
On Friday, Ether shorts faced their largest single-day loss in months as the Ether price crossed the $4,000 mark for the first time since December 2024. Data from CoinGlass Ether data showed that approximately $105 million Ether shorts were liquidated, representing about 53% of the $199.61 million in total short liquidations across the cryptocurrency market.
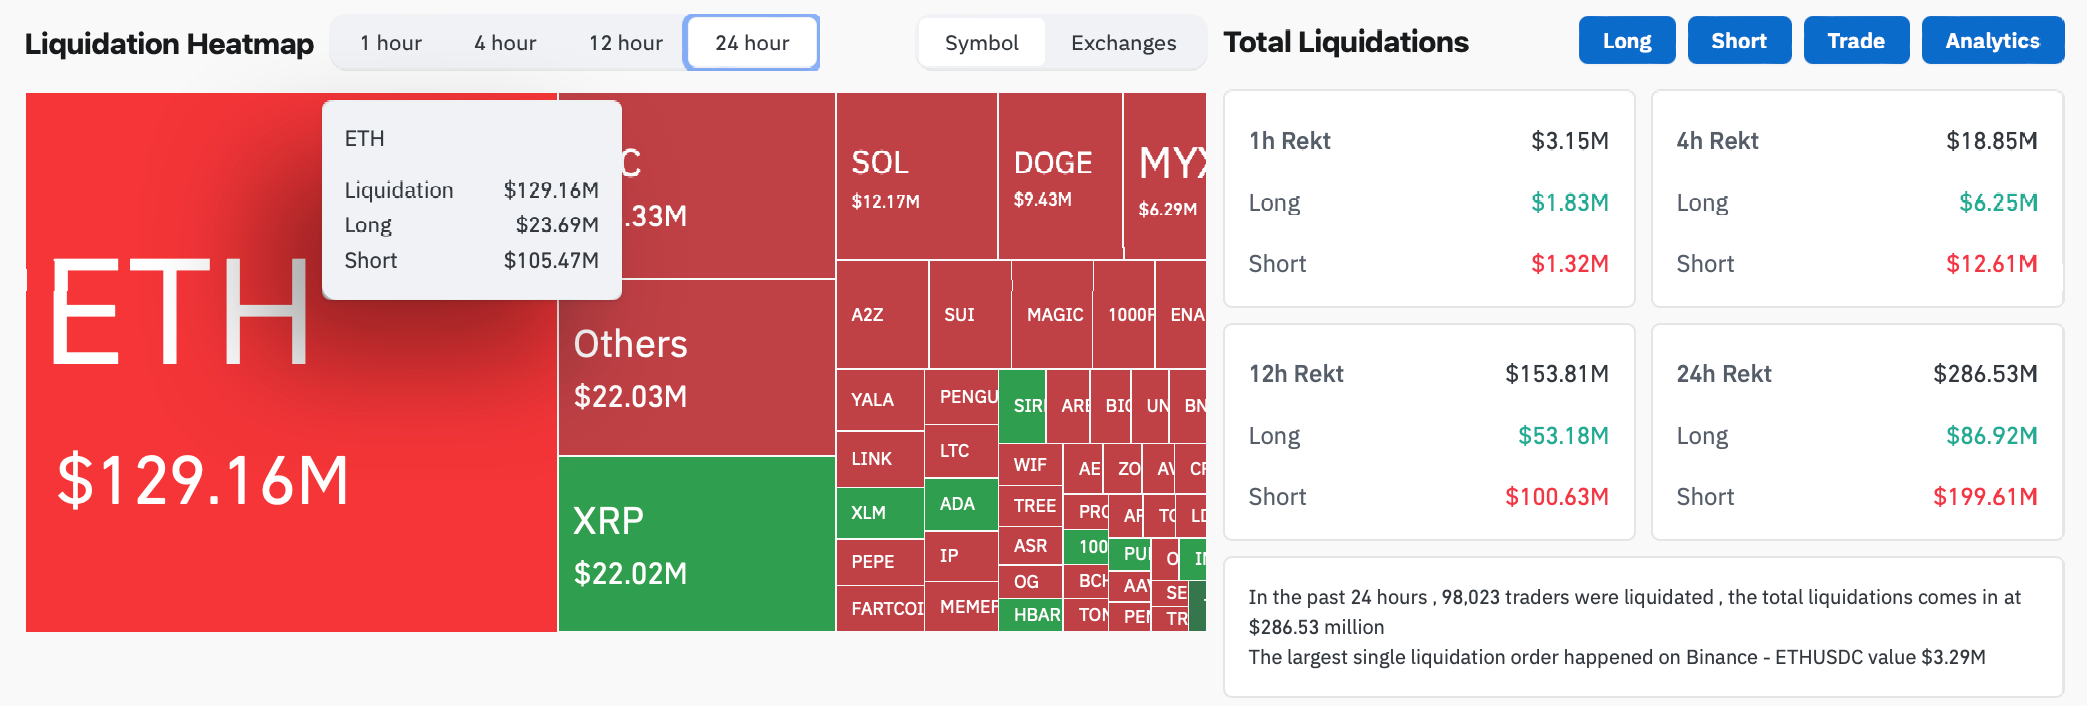
In total, Ether liquidation over the past 24 hours reached $129.16 million, covering both short and long positions. The $4,000 Ether surge came during high trading activity, with the price climbing to $4,060 before easing to $4,015, according to Nansen Ether price data.
The rally marked the highest price for Ether in eight months, pushing it to the top of the daily liquidation charts across all crypto assets.
Eric Trump Comments on Ether Price Rally
The $4,000 Ether move prompted a response from Eric Trump, son of U.S. President Donald Trump, who addressed his 5.8 million followers on X.
“It puts a smile on my face to see ETH shorts get smoked today. Stop betting against BTC and ETH — you will be run over,”
he wrote. The Eric Trump Ether comment came shortly after news of the large $105 million Ether shorts wipeout.
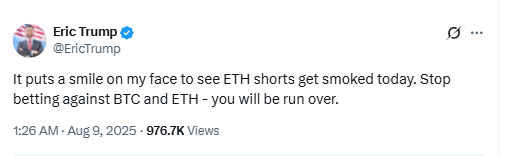
Trump’s post referenced traders holding short positions in Bitcoin and Ether as both assets saw price increases during the session.
$4,100 Ether Resistance Level Monitored by Traders
Market participants identified $4,100 Ether resistance as the next significant price level to watch. Crypto trader Ash Crypto called it a “major resistance” and said breaking above it could affect market positioning.
The chart posted by Ash Crypto shows Ether’s historical price movements with highlighted resistance and support zones. According to his analysis, the $4,000 Ether price acts as a key psychological threshold, but the $4,100 Ether resistance remains the major technical barrier.

In the image, two previous instances are marked where Ether approached a similar resistance level and faced strong selling pressure, leading to price declines. These zones are visually represented with yellow rectangles, emphasizing repeated market reactions at comparable levels.
The chart outlines a possible bullish path if Ether breaks above the $4,100 resistance. Ash Crypto explains that clearing this level could create a short squeeze. This would force traders holding short positions to buy back at higher prices. As a result, the upward movement could accelerate.
The projection in the chart shows a target range between $4,400 and $4,500. An upward green arrow extends from the breakout point to mark this possible move.
At the bottom of the chart, a support level is clearly marked. This is where Ether has historically found buying interest during declines. The level sits well below the current market price. Therefore, the $4,100 test holds significant importance for determining short-term momentum.
The Ether price approached this level during Friday’s rally, sparking discussion over possible trading shifts. Alongside this, Ethereum ETF inflows have shown notable strength. Over the last four trading days, spot Ethereum ETF inflows reached $537 million, according to Farside data.
These inflows follow weeks of steady interest in Ether-related investment products, contributing to heightened market activity and influencing derivatives positions.
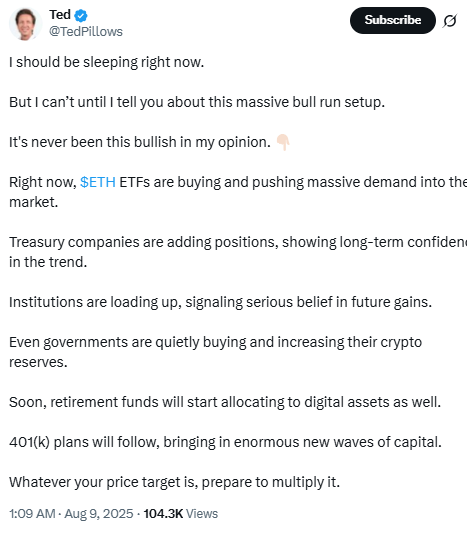
Institutional Interest and Price Discussions
Crypto trader Ted pointed to increasing institutional demand for Ether and Ethereum ETF inflows as part of current market trends.
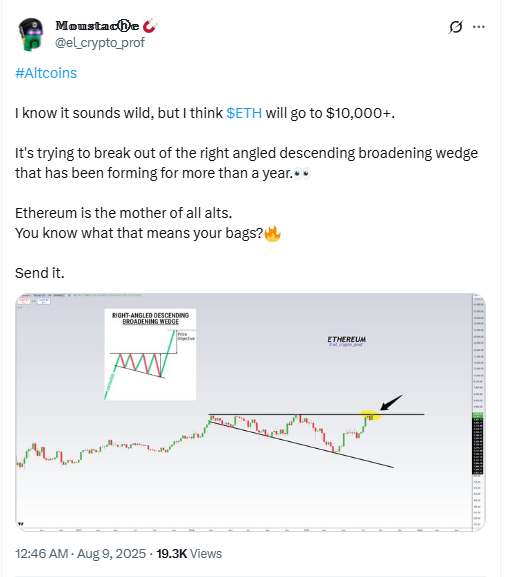
Other traders also commented on future price levels.
The chart shared by Moustache displays Ether’s price action forming what he identifies as a right-angled descending broadening wedge — a technical pattern often associated with potential bullish reversals when broken to the upside.
In the chart, the lower boundary slopes downward, connecting a series of lower lows, while the upper boundary is horizontal, marking a consistent resistance line. This structure has been developing for more than a year, as noted in his post. The current Ether price action is positioned at the upper boundary of the wedge, highlighted in yellow, indicating a possible breakout attempt.
Above this resistance, the chart shows open space for potential upward movement if the breakout holds. Historical price action within the wedge shows repeated oscillations between the upper and lower boundaries, with each downswing attracting buyers at progressively lower levels until momentum brings the price back toward resistance.
Moustache’s mention of a $10,000+ Ether price is tied to the potential strength of a breakout from such a long-term formation. While the chart does not assign numerical targets beyond the breakout zone, the implication is that a sustained move above this horizontal resistance could lead to extended bullish momentum, supported by the historical behavior of this pattern in technical analysis.
Separately, Fundstrat co-founder Tom Lee told CNBC that Ether could be having its “Bitcoin 2017 moment” and may reach $16,000.
These statements follow a period of high volatility in the Ether market, with leveraged positions and Ether liquidation levels influencing price movements in recent sessions.
