NOIDA (CoinChapter.com) — XRP continues to defy market expectations in 2025, maintaining its upward trajectory despite broader volatility in altcoins. After starting the year just above $2, the token surged 70% to a local peak of $3.4 in January and, as of May 2, trades near $2.21.
This marks a 10.5% year-to-date gain, keeping pace with its large-cap peers and helping XRP’s role as one of the year’s more resilient assets. Its current range, though slightly below the recent high, reflects sustained accumulation rather than exhaustion—a rare dynamic in a market often dominated by leverage-driven speculation.
While Bitcoin’s gains have captured headlines, XRP’s advance appears more structurally sound. Technical signals point to healthy buying in the spot market, supported by favorable liquidity flows and a steady expansion in use-case discussions.
The token’s legal clarity and Ripple’s expanding partnerships have shaped a favorable macro environment. As institutional sentiment stabilizes and strategic narratives around digital payments evolve, XRP is increasingly viewed as more than a remittance token.
Here are three reasons XRP could be one of the most overlooked opportunities in today’s crypto market.
Spot Premium Surge Separates Signal from Speculative Noise
XRP’s latest rally appears to be underpinned by real demand rather than speculative excess. On May 2, crypto analyst Dom spotlighted a technical indicator: the spot premium. The metric tracks the price difference between XRP’s spot market rate—what buyers pay for the token—and its perpetual futures contracts involving leveraged exposure.
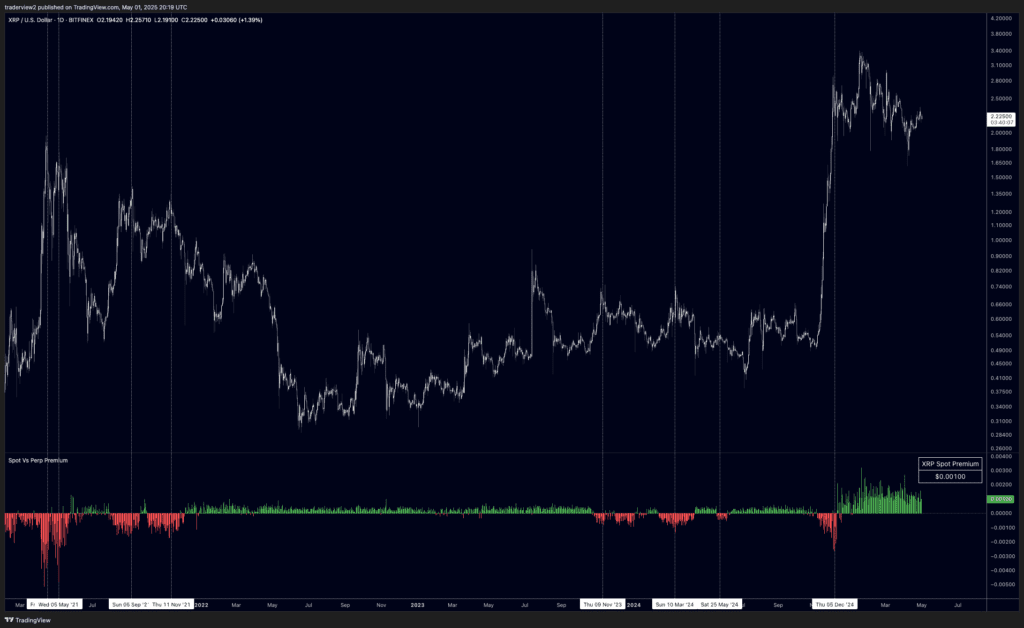
A positive premium means the spot price exceeds the futures price, indicating buyers opt for ownership over leverage. As of May 1, the Ripple token’s spot premium stood at +$0.01—the highest ever recorded. Historically, major XRP peaks in 2021 and 2023 occurred during negative premiums, where perp prices led the market and reversed sharply.
The current setup reflects the opposite: a trend supported by genuine accumulation. XRP trades near $2.21 after climbing over 250% since late 2023, and the surge has reignited speculative chatter. Rumors emerged that Ripple might acquire Circle, the issuer of USDC, in a $20 billion deal that would potentially elevate XRP’s role as a native bridge asset between USDC and Ripple’s RLUSD.
But Dom Kwok, co-founder of EasyA, and others dismissed the rumors, citing Circle’s IPO valuation of nearly $5 billion. Kwok clarified that Circle’s $60 billion in collateral is not owned capital but reserve backing for its stablecoins. In a market prone to hype cycles, the contrast between on-chain strength and acquisition rumors highlights the need to separate verifiable fundamentals from narrative inflation.
Whale Accumulation and Fund Inflows Signal Institutional Confidence
XRP’s recent consolidation near the $2.20 mark coincides with a sustained uptick in both whale activity and institutional inflows, reinforcing the view that larger players are positioning for long-term exposure. Glassnode data shows a consistent increase in XRP addresses holding over 10,000 tokens.
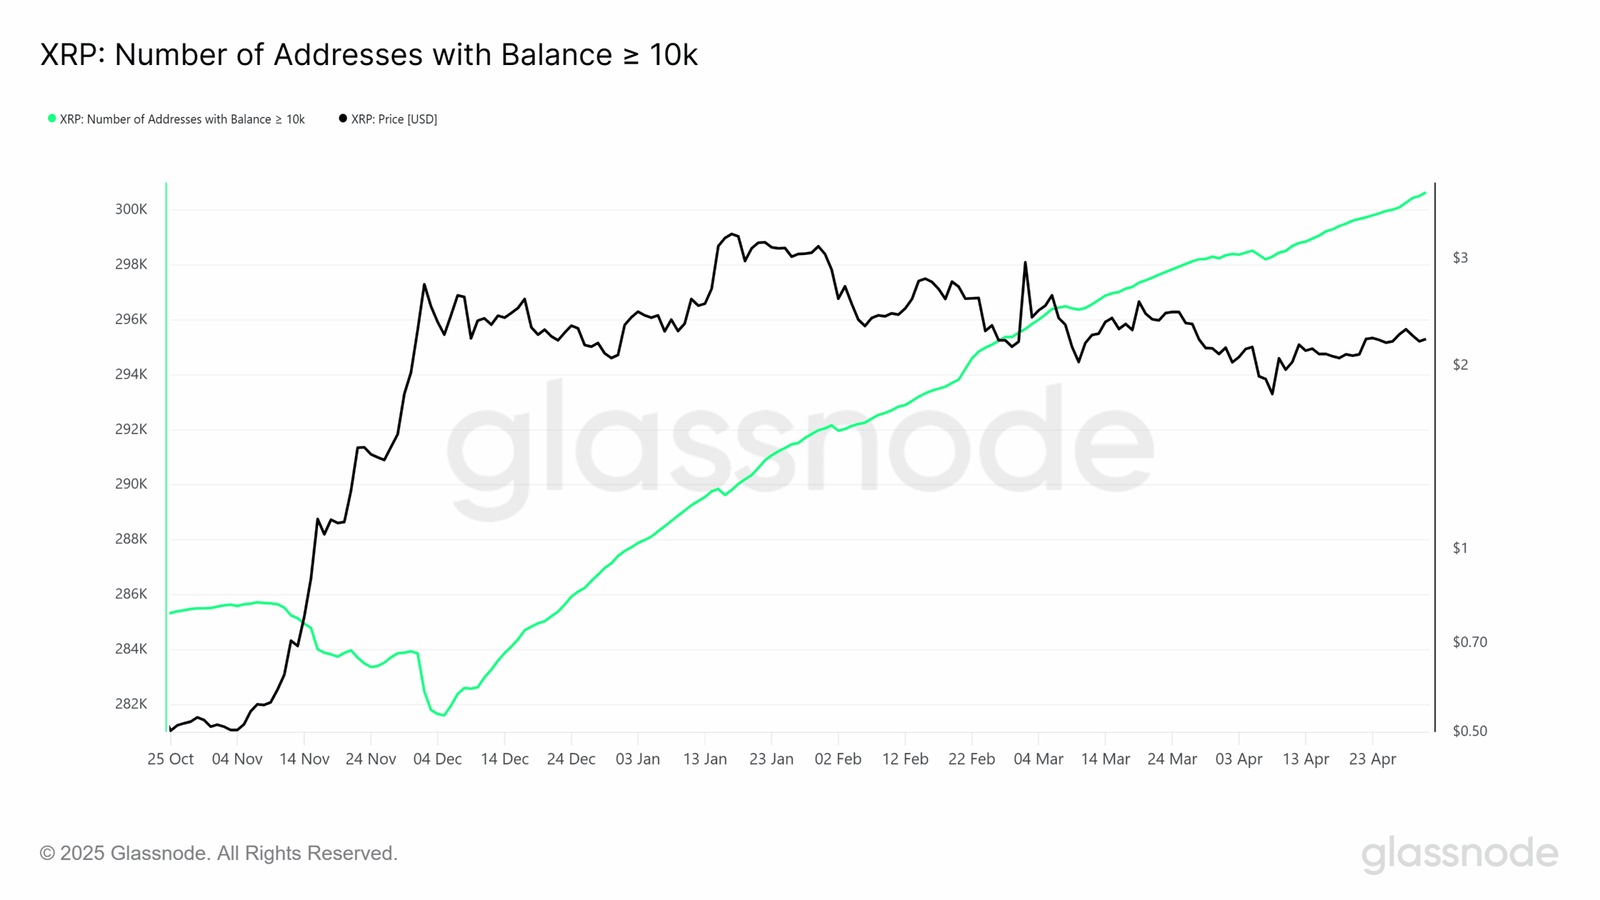
The wallet class—typically associated with strategic investors—rose sharply from late 2024 through April 2025, even as XRP retraced from its January peak of $2.42. Notably, this accumulation trend persisted during the 35% pullback between January and April, indicating that whales treated the correction as a buying opportunity rather than a signal to exit.
That on-chain trend aligns closely with capital movement in traditional finance. According to the latest CoinShares Digital Asset Fund Flows report, XRP recorded $31.6 million in weekly inflows ending May 2, totaling $70.7 million month-to-date and $246 million in year-to-date flows.
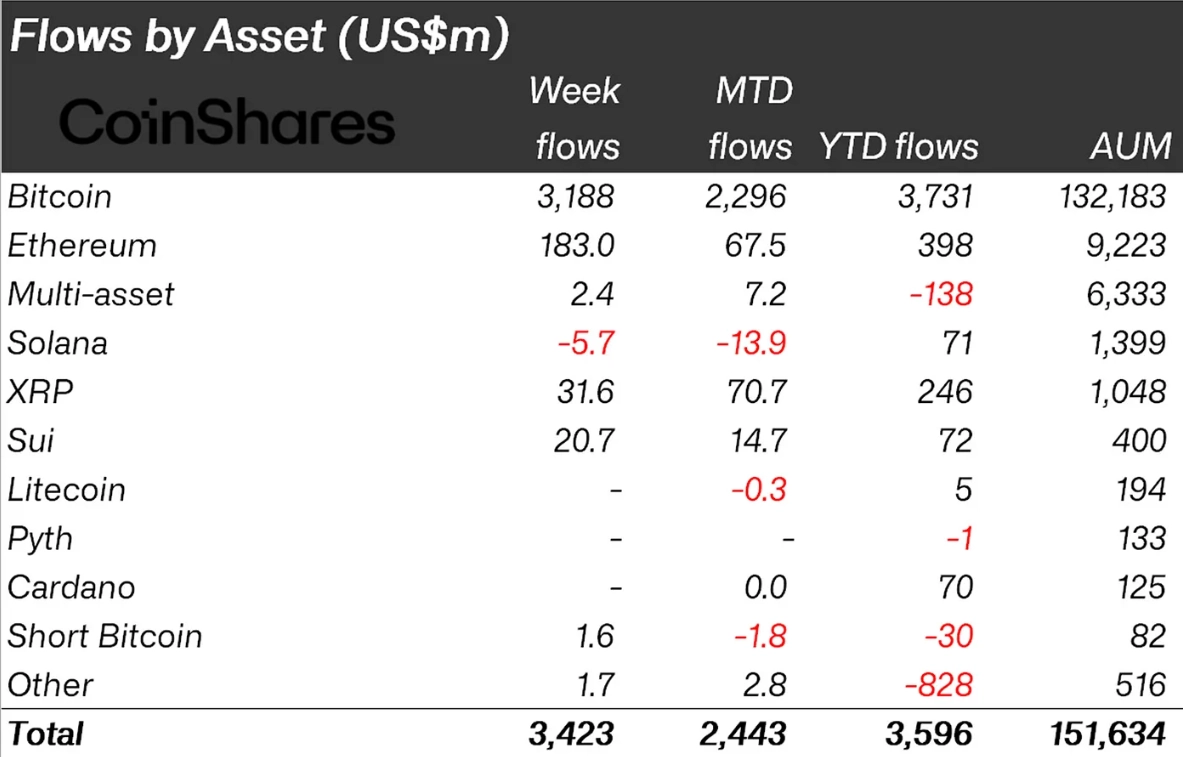
XRP now ranks among the top recipients of institutional capital, outpacing most other altcoins outside Bitcoin and Ethereum. These inflows suggest growing interest from asset managers and structured funds, possibly driven by XRP’s increasing regulatory clarity and its expanding use case within Ripple’s cross-border infrastructure.
The on-chain and fund flow data point to conviction buying, not speculation. While retail sentiment continues to chase narratives, the behavior of deep-pocketed investors reflects a more calculated strategy: accumulate during periods of weakness and position ahead of potential catalysts.
Bullish Falling Wedge Structure Points to Potential Breakout
The XRP price has formed a classic falling wedge pattern, often associated with trend continuation after a sharp move. Two downward-sloping trendlines—one tracing lower highs, the other lower lows—converge toward a compression point forming the pattern.
Unlike descending channels, falling wedges typically appear during consolidation phases. Traders usually consider the pattern bullish when it occurs after a prior uptrend. The pattern suggests that selling pressure is weakening over time while buyers absorb supply at gradually higher levels.
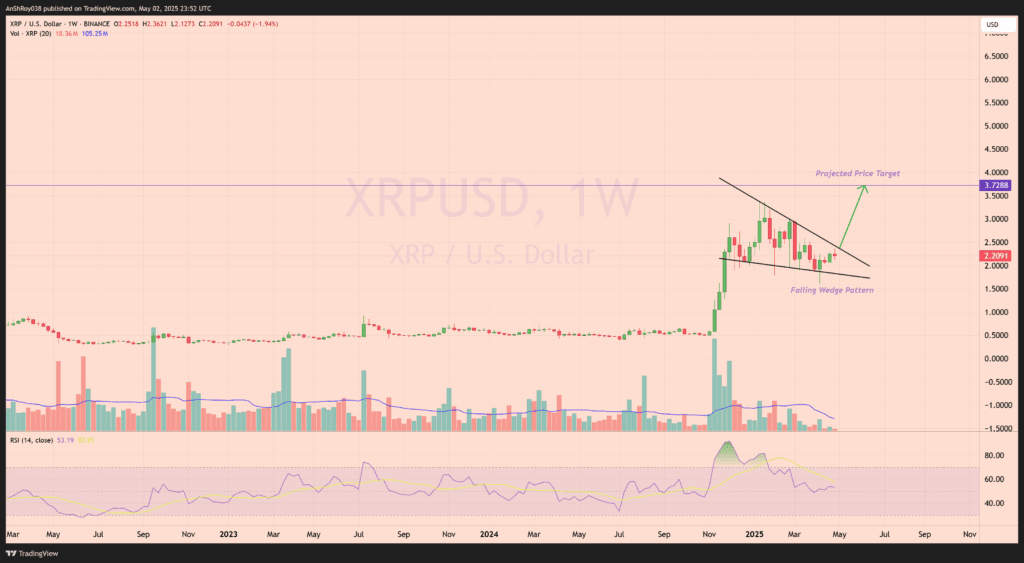
The current structure has formed since XRP price’s January peak, with each successive weekly candle tightening the range. Volume has declined throughout the formation, consistent with wedge dynamics that typically lead to breakouts on a volume spike. The RSI has held above the 50 level and is attempting a rebound, reinforcing the case that momentum may be shifting back in favor of bulls.
Technical projection for a falling wedge breakout involves measuring the maximum vertical distance between the wedge’s highest and lowest points—the wedge’s “thickness”—and adding that height to the breakout level, usually near the upper trendline. Based on this method, the projected move aligns with a retest of prior highs.
While the breakout has not yet been confirmed, the structure suggests that XRP price is compressing within a bullish continuation setup. The market could enter a new impulsive phase if volume expands and price clears the wedge’s resistance line. Until then, bulls and bears remain locked in a technical stalemate.
