
1. Bitcoin (BTC)
Bitcoin is currently trading near $93,902, reflecting a cautious stance ahead of the U.S. Federal Reserve’s interest rate announcement on May 7, 2025. The 4-hour chart shows Bitcoin testing key support just below the 50-period Exponential Moving Average (EMA), currently at $94,853. This level has historically served as a short-term trend guide, and Bitcoin’s struggle to hold above it signals possible near-term weakness.
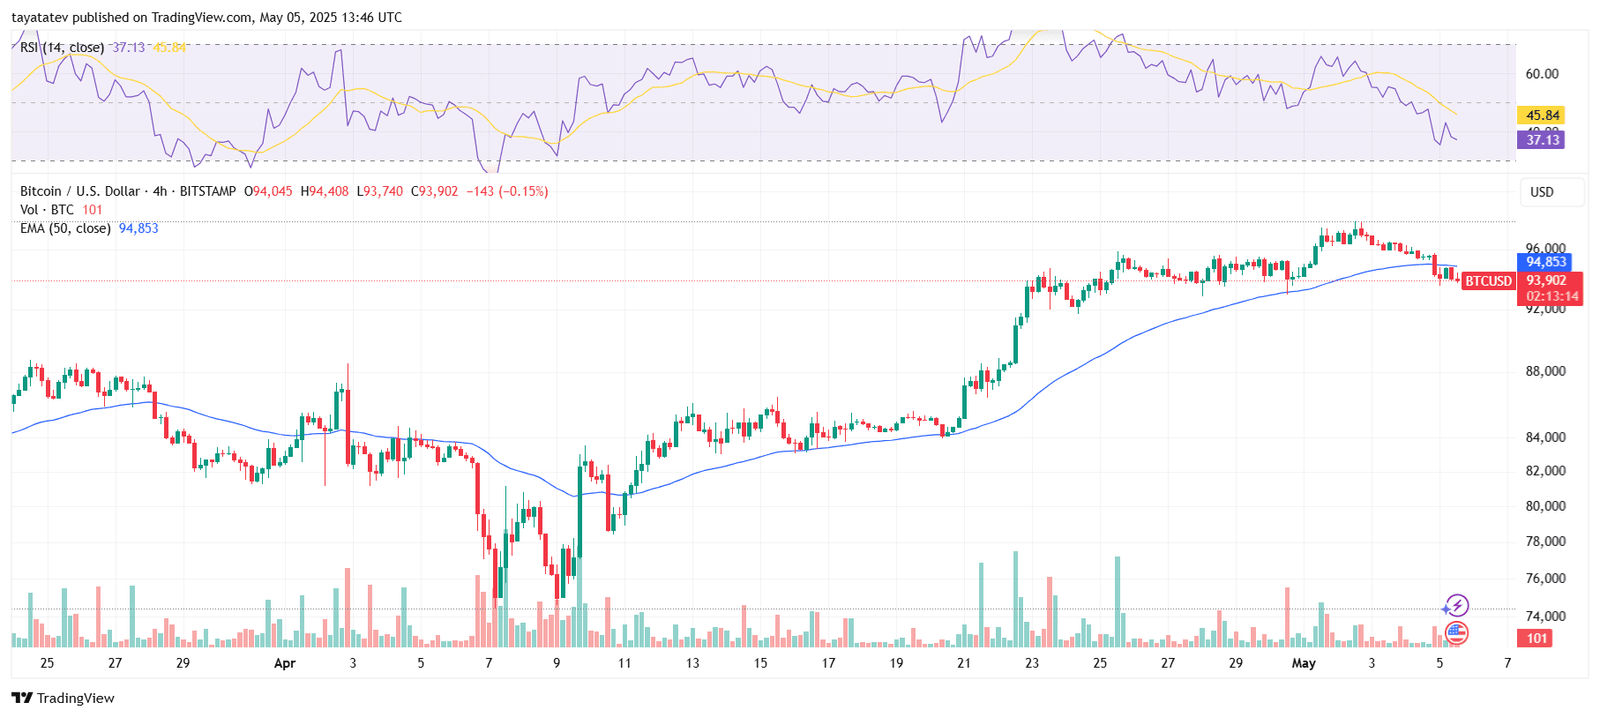
At the same time, the Relative Strength Index (RSI) is at 37.13, staying below the signal line (45.84) and the neutral 50 zone. This RSI behavior suggests weakening bullish momentum and growing selling pressure. In previous sessions, RSI dips below 40 often preceded deeper price corrections, especially when accompanied by low volume recovery attempts.
The chart also shows a potential “Flag and Pole” continuation pattern, which typically signals a bullish setup. This pattern began forming after the strong rally in late April, where Bitcoin climbed from under $84,000 to a peak above $96,000. Since then, prices have moved sideways to slightly lower, forming a consolidating flag. If the pattern completes with a high-volume breakout, the next upside target lies above the $100,000 mark. However, Bitcoin first must reclaim the $96,500–$97,000 resistance zone, which aligns with the upper range of the flag structure.
Standard Chartered’s head of digital assets research, Geoff Kendrick, expects Bitcoin to reach a new all-time high of $120,000 by the end of Q2 2025. His forecast is driven by macroeconomic uncertainty, especially concerns around interest rates and recessionary risks, as well as increased institutional adoption of Bitcoin as a non-correlated store of value.
Volume analysis on the chart also shows a recent decline, suggesting market participants are on hold until the Fed clarifies its policy stance. With Bitcoin’s dominance still above 53% and stablecoin inflows rising, many traders are positioning defensively, expecting a volatile reaction post-announcement.
If Bitcoin breaks below $93,700 with sustained volume, the next support may appear near $91,000 and $89,000. However, if buyers regain momentum and push BTC above the $96,500 threshold, a breakout could trigger a quick move toward the psychological $100,000 mark.
2. Ethereum (ETH)
Ethereum trades near $1,797 on May 5, losing grip on the $1,800 level as selling pressure builds. The 4-hour chart shows ETH dropping below the 50-period Exponential Moving Average (EMA), now acting as short-term resistance at $1,808. This shift signals growing bearish momentum.
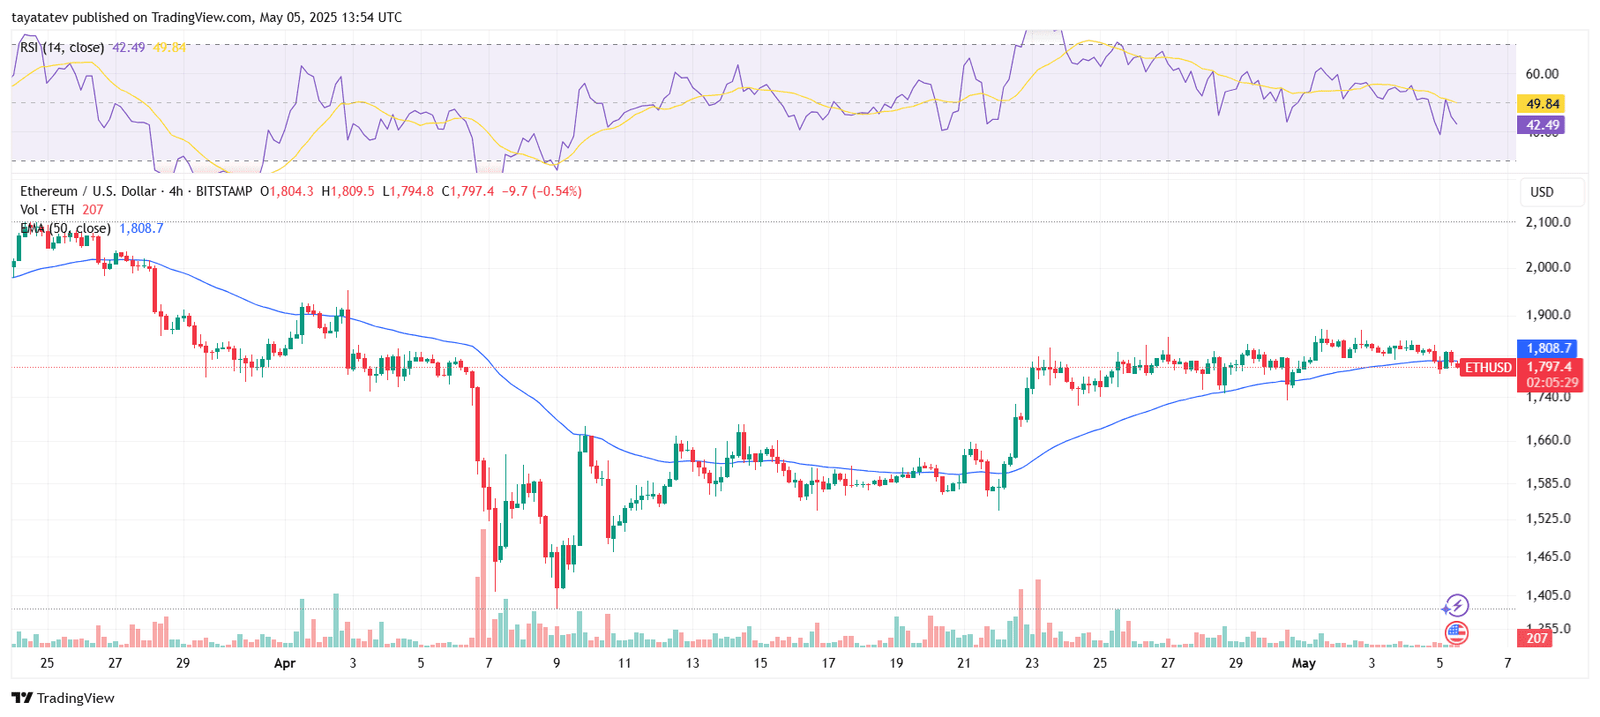
The Relative Strength Index (RSI) reads 42.49 and remains under its signal line, confirming weakening buyer interest. Recent price action shows multiple failed attempts to hold above the EMA, reinforcing the trend reversal. Trading volume has also declined, suggesting hesitation among participants.
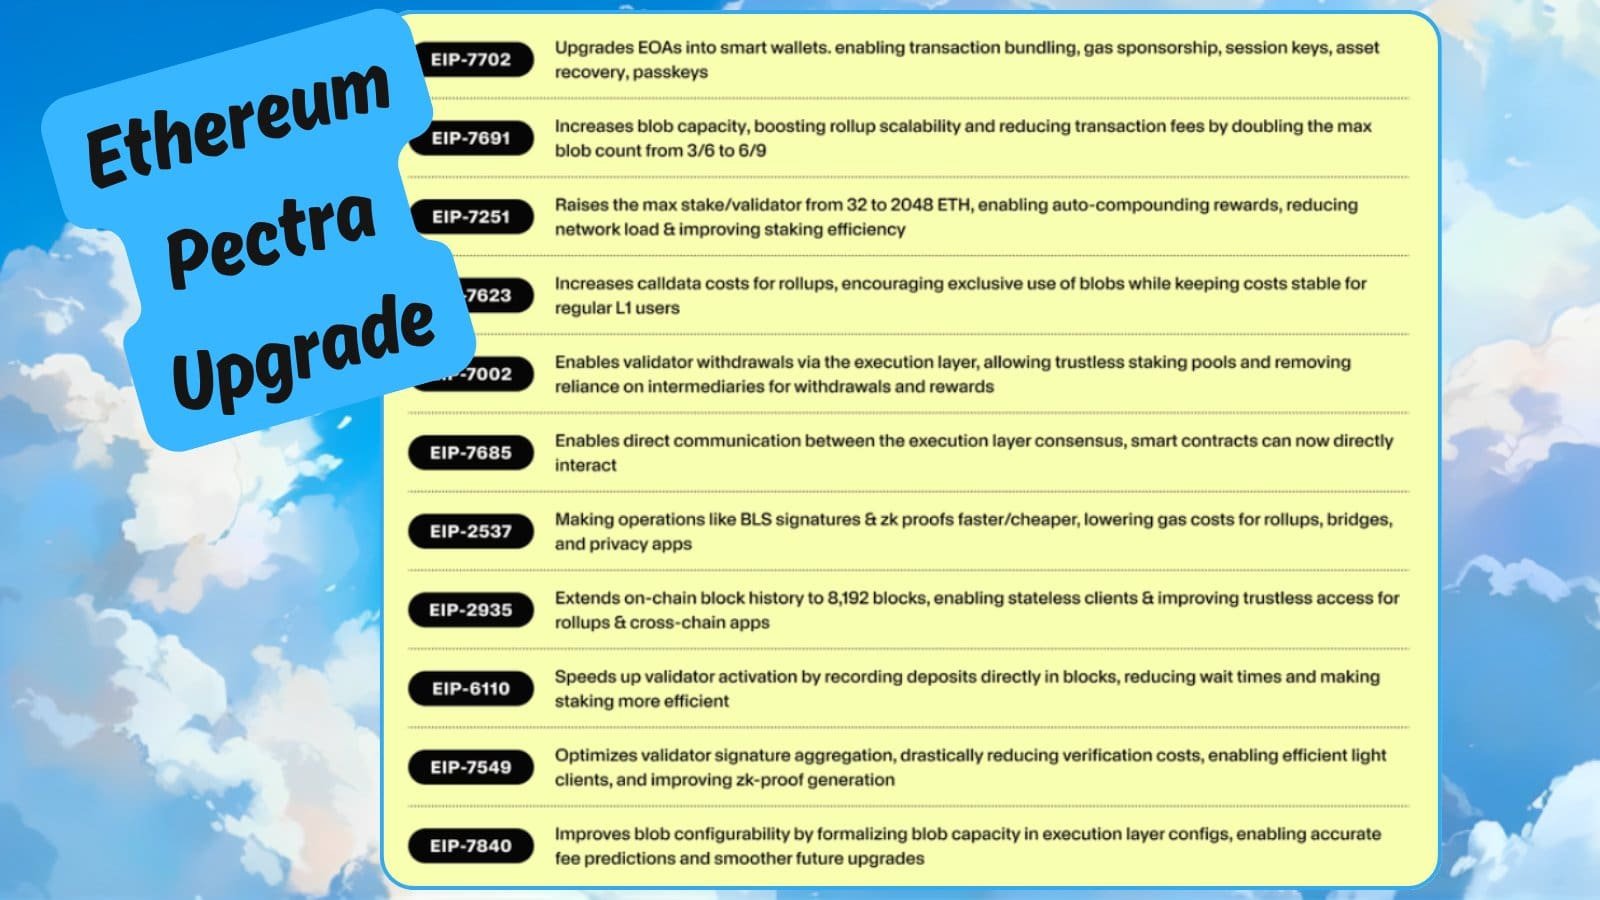
On May 7, Ethereum’s Pectra upgrade will go live. The update will improve staking and validator interaction. However, the price response remains subdued, as macro uncertainty ahead of the Federal Reserve’s rate decision weighs on the broader crypto market.
Ethereum gained 47% during 2024, a slower pace than previous cycles. It has also trailed Bitcoin and Solana in recent months, reducing its dominance across major DeFi sectors. This relative weakness limits bullish conviction, especially when key technical levels break.
If ETH fails to recover $1,808 soon, the next visible supports are near $1,740 and $1,700. Reclaiming the EMA and pushing above $1,850 would be needed to signal renewed upside momentum. Until then, pressure remains on the downside as traders await this week’s policy signals.
3. Solana (SOL)
Solana trades around $144 on May 5, showing signs of consolidation after a strong rebound from April lows. Despite bullish forecasts that price may hit $600 by the end of 2025, Solana has struggled to break past a critical resistance near $155. This level served as both a psychological and technical barrier in past cycles.
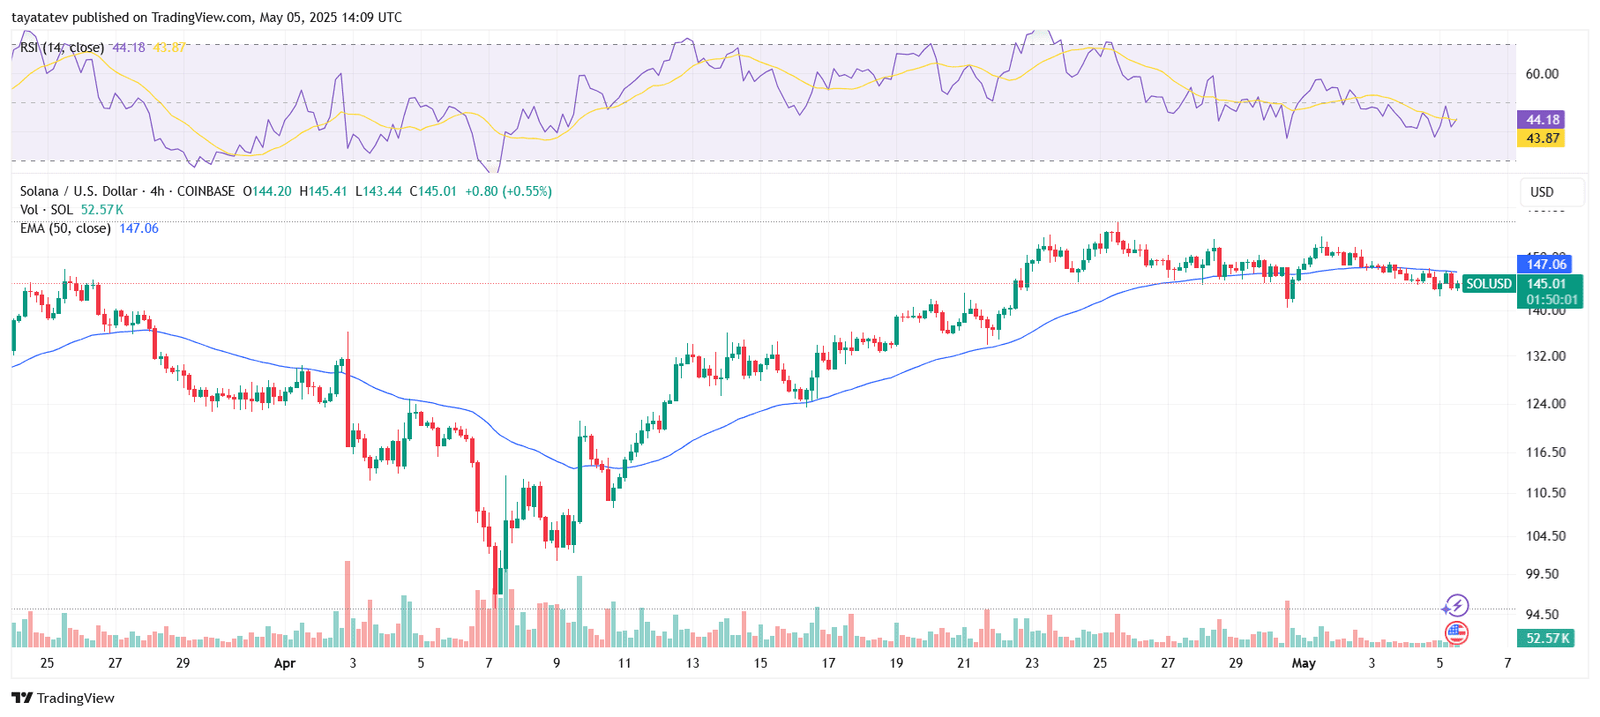
The rejection at this zone follows a notable rise in trading volume in late April, which pushed SOL up from below $130 to over $150. However, price momentum has slowed, and recent candles show smaller bodies with long wicks, indicating indecision among buyers and sellers. The $155 mark has now acted as a ceiling multiple times in the past year, and Solana’s failure to close above it weakens the near-term outlook.
At the same time, the broader interest in Solana remains intact. The network continues to grow its decentralized finance (DeFi) and NFT presence. More developers are building on Solana, and total value locked (TVL) in Solana-based protocols has climbed steadily throughout Q2. This adoption fuels long-term optimism, even though short-term technicals remain mixed.
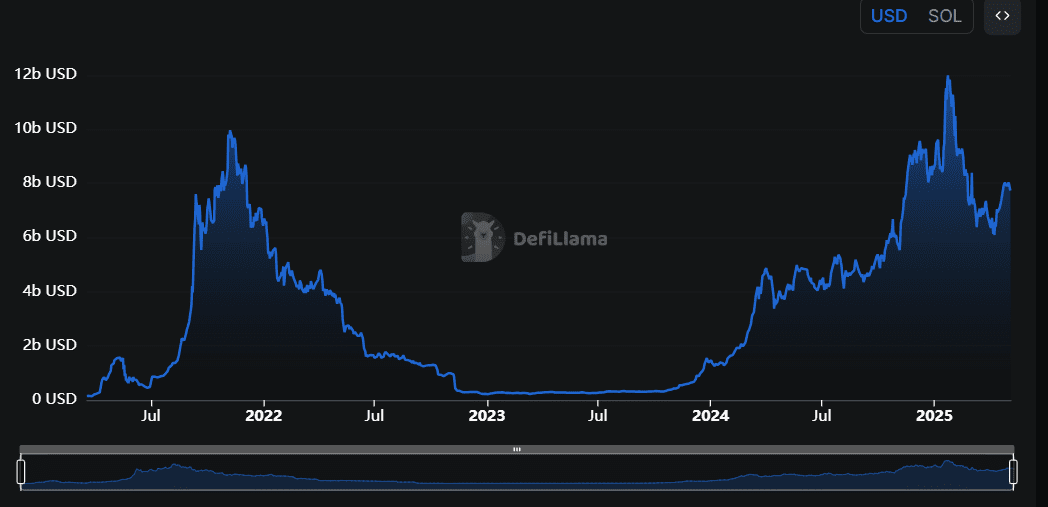
According to recent reports, institutional interest is also increasing. The Financial Times highlighted how trading platforms and funds are exploring exposure to Solana-based assets due to their performance and network efficiency. Still, this narrative has yet to fully translate into sustained buying pressure at key breakout zones.
If Solana can reclaim and hold above $155.03 with strong volume, it may trigger a move toward $170. But if it continues to face rejection, support lies at $138 and further down at $130. Momentum indicators also suggest caution. The Relative Strength Index (RSI) has cooled off from overbought levels and now sits in a neutral zone, giving room for either side to gain control.
For now, Solana remains in a holding pattern—bullish in the long term, but technically stuck just below a crucial resistance. Traders will watch for a decisive breakout or breakdown in the coming sessions.
4. Dogecoin (DOGE)
Dogecoin trades near $0.1707 on May 5, slightly down for the day as selling pressure builds. The 4-hour chart shows DOGE trading below the 50-period Exponential Moving Average (EMA), which sits at $0.1758. This breakdown signals short-term bearish momentum.
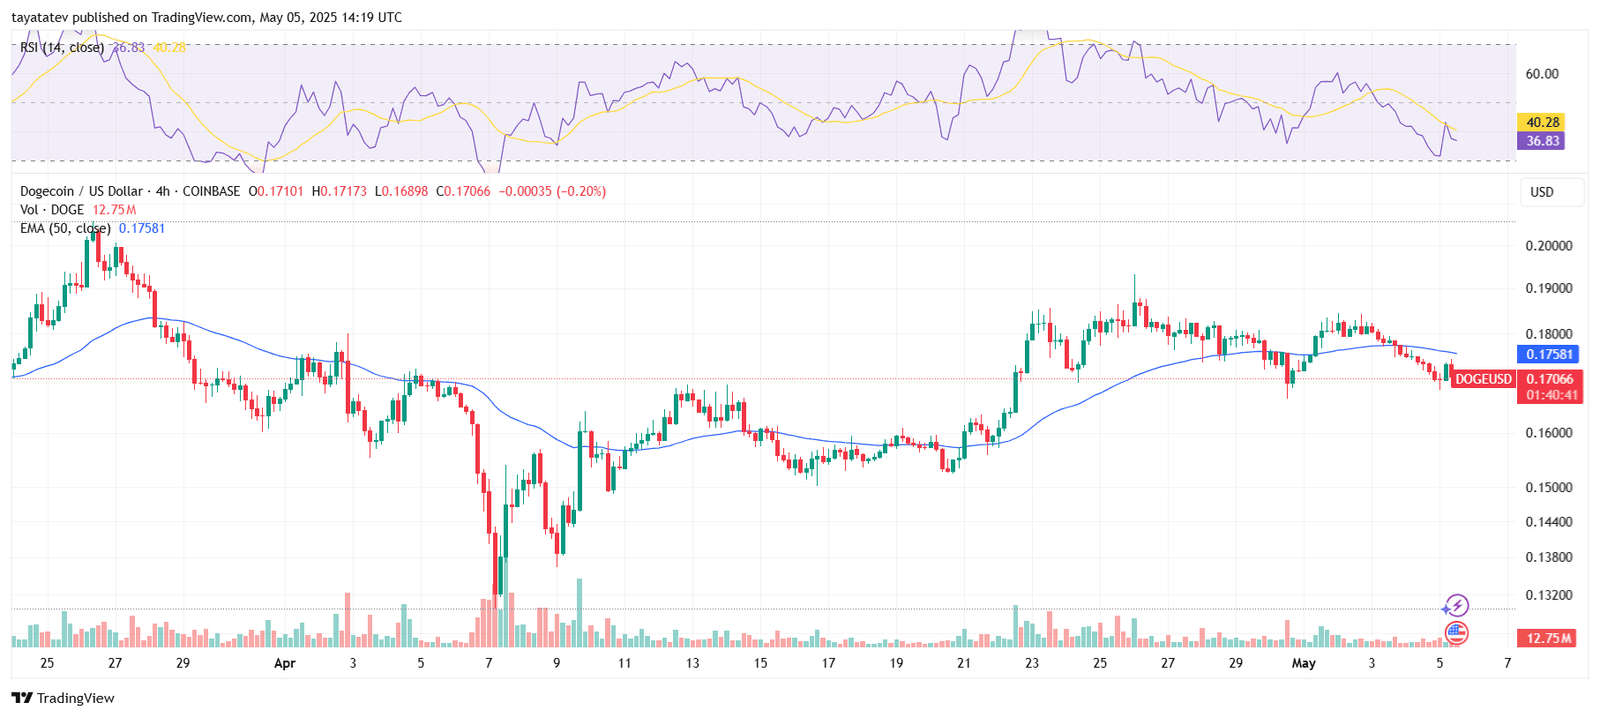
The Relative Strength Index (RSI) sits at 36.83, well below the neutral 50 mark. This reflects weak buying momentum. The RSI’s failure to rebound above its signal line at 40.28 also confirms continued downside pressure.
Dogecoin remains stuck in a wide range between $0.16 and $0.20. The upper boundary near $0.20 has repeatedly acted as strong resistance. Breaking above this level could open the door to higher prices, but so far, bulls have failed to reclaim it.
Volume has picked up in recent sessions, indicating active trading. However, the rising sell volume shows that sellers are gaining control. Unless DOGE reclaims the EMA and climbs above $0.18 soon, it may retest support near $0.1640 and $0.1580.
Despite short rallies earlier this year, DOGE has dropped nearly 60% year-to-date. The meme-driven momentum from previous bull cycles has faded, and without a strong catalyst or network upgrade, price action remains limited.
For now, Dogecoin must reclaim higher ground to change its short-term trend. A breakout above $0.20 remains the key hurdle for bulls. Until then, the chart signals caution.
5. Uniswap (UNI)
Uniswap is trading around $4.97 on May 5, slipping further below its 50-period Exponential Moving Average (EMA), now at $5.26. This downtrend has remained intact since April, with recent candles showing steady lower highs and fading volume on bounce attempts.
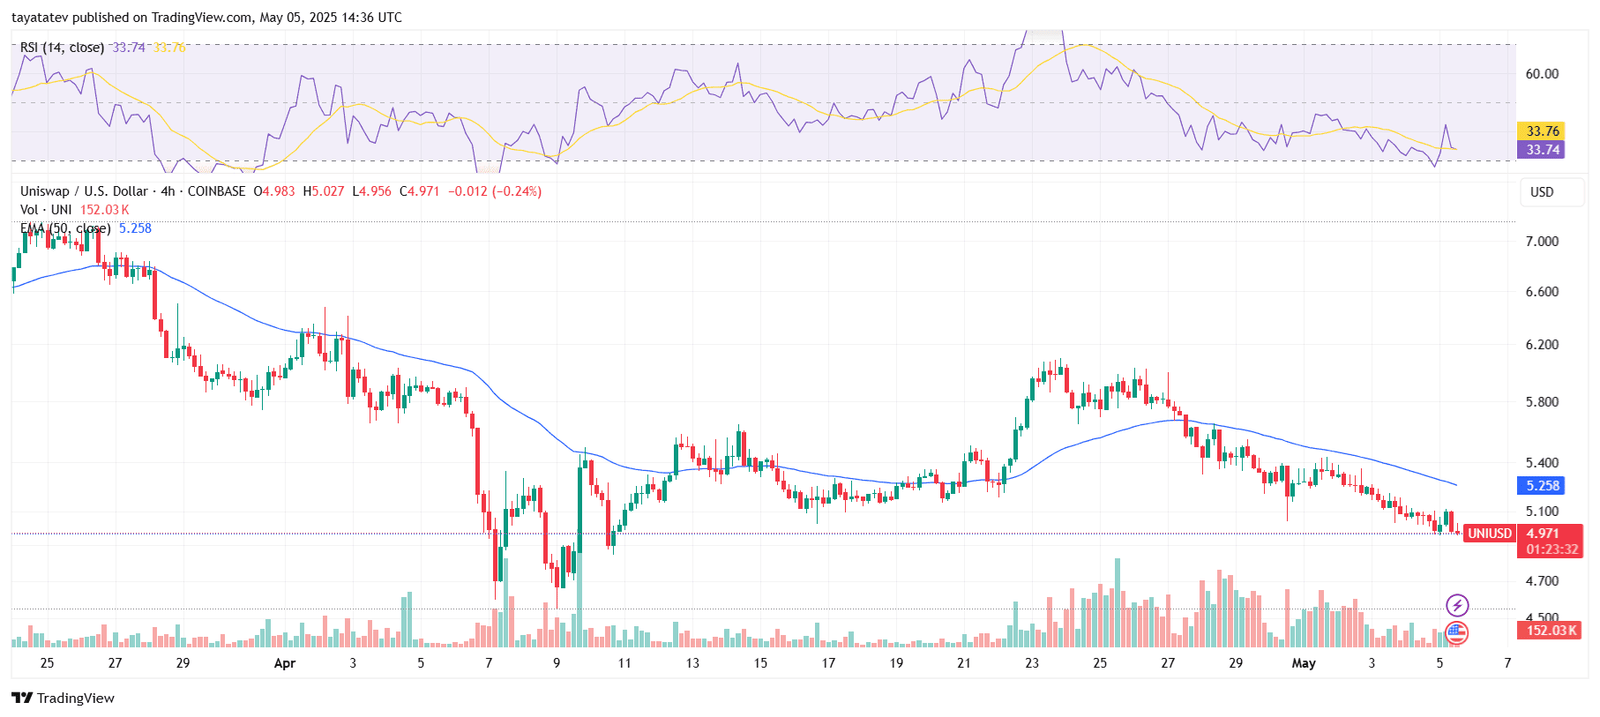
The Relative Strength Index (RSI) reads 33.74, deep in bearish territory. It mirrors price weakness and reflects a lack of strong buyer interest. The RSI also trails below its signal line, confirming the continued downside momentum.
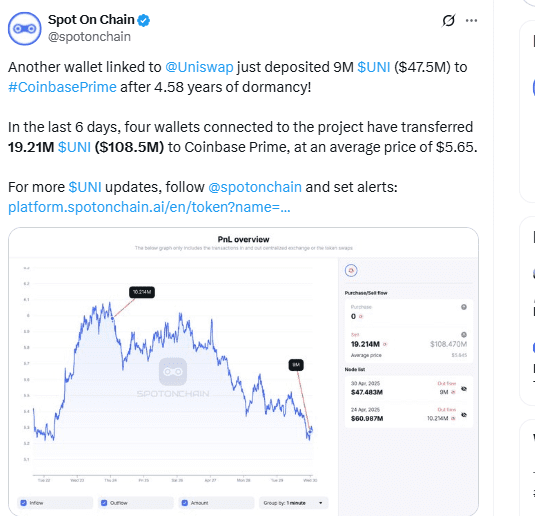
Meanwhile, whale activity has sparked speculation about possible positioning ahead of the upcoming Federal Reserve announcement. Several large UNI token transfers to Coinbase Prime suggest that major holders may be preparing for increased volatility or profit-taking. These movements align with cautious sentiment across the broader crypto market.
If UNI breaks below its recent low near $4.85, the next support lies around $4.60. To regain momentum, bulls must push the price back above the EMA and sustain a move over $5.40. Until then, downward pressure is likely to persist.
For now, Uniswap’s chart shows weakness, but long-term forecasts depend on whether the protocol continues to lead in DeFi activity and if the broader market stabilizes post-Fed decision.
