
On May 21, 2025, the 5-hour chart of Pi Coin paired with Tether (PIUSDT) revealed a 5.54% decline over five candlesticks. The move followed a short-lived breakout that failed to hold its gains above the $0.82 level.
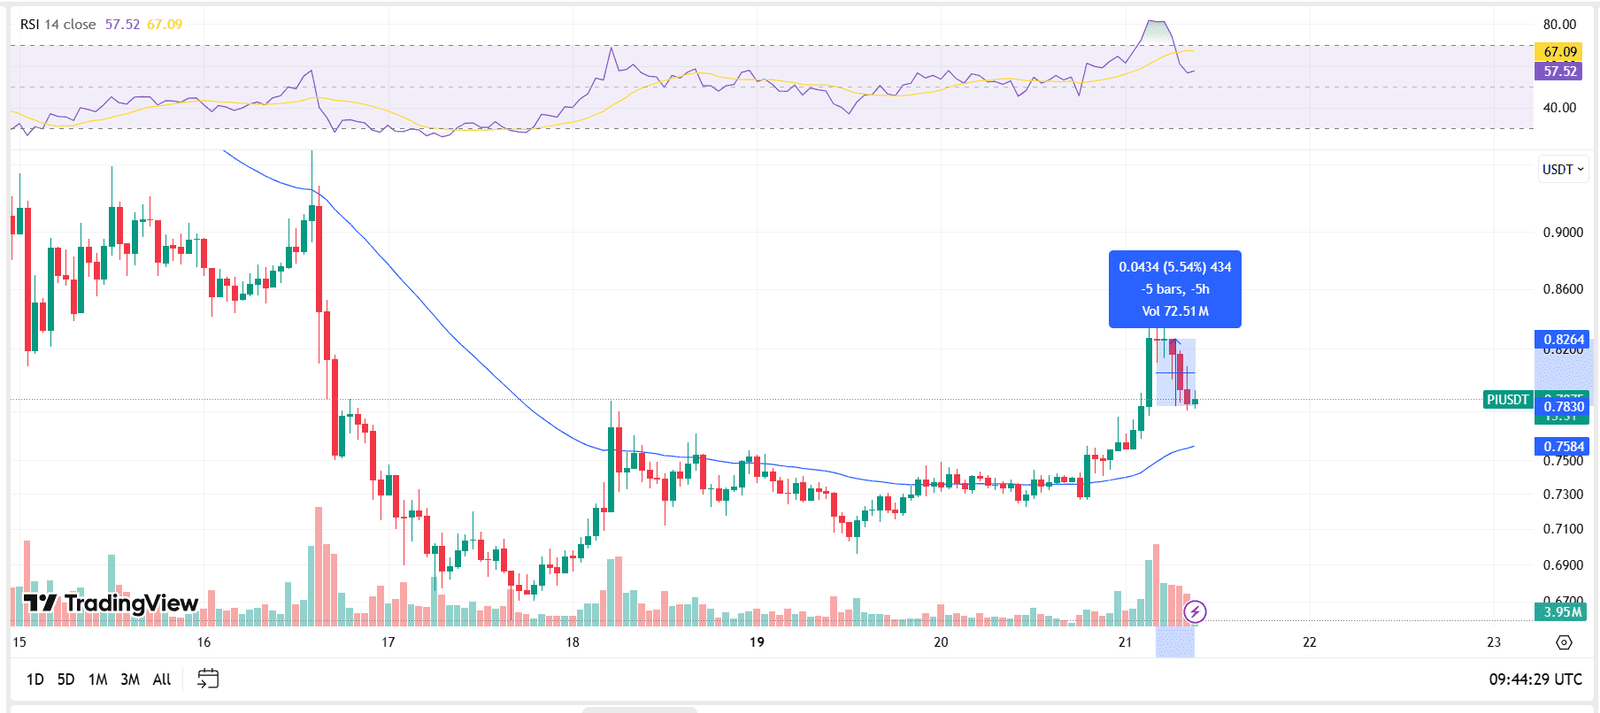
Trading volume spiked to 72.51 million during the retracement, marking one of the most active sell sessions of the day. At the same time, the Relative Strength Index (RSI), a momentum oscillator, dropped from overbought territory and now reads 57.52. This shift signals weakening bullish strength.
Meanwhile, the 50-period Exponential Moving Average (EMA) sits near $0.7584, providing dynamic support. Pi Coin bounced from this EMA earlier during its ascent, showing traders are watching it closely for further price reactions.
The volume bars below show declining interest during the recent pullback, hinting that selling pressure may be cooling. However, unless the price breaks above the short-term resistance, recovery remains uncertain.
Pi Network Decouples From Bitcoin as Bearish Signals Strengthen
Meanwhile, Pi Network’s link to Bitcoin has weakened sharply. The correlation between the two assets now stands at -0.16, according to TradingView data. This negative reading means that Pi Network no longer moves in sync with Bitcoin. While Bitcoin’s price holds steady near $106,000 and eyes a possible all-time high, Pi Network is failing to follow.
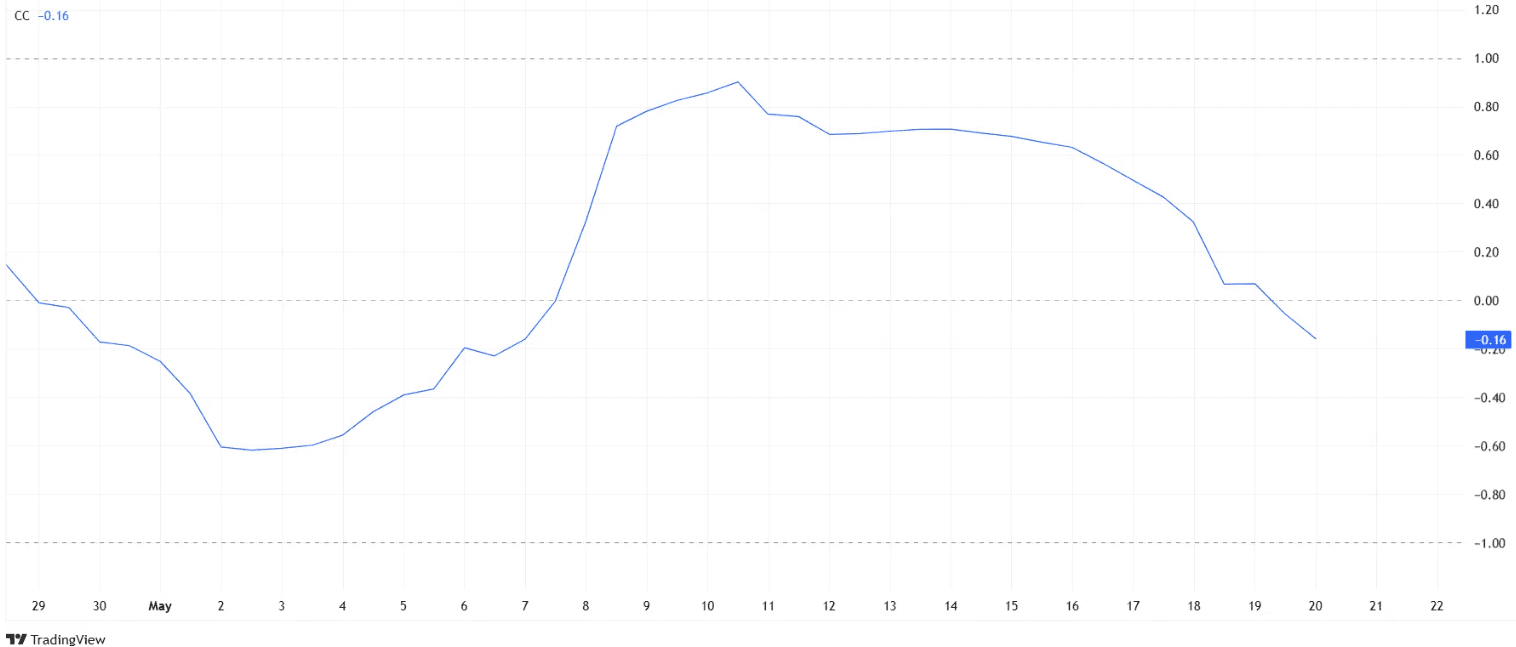
Traditionally, altcoins such as Pi Network rise when Bitcoin gains momentum. This correlation often helps smaller assets attract interest during bullish market phases. However, Pi Network’s recent detachment suggests it may now face downward pressure even as Bitcoin strengthens.
Momentum Shifts as MACD Turns Bearish
The Moving Average Convergence Divergence (MACD) indicator has confirmed a bearish trend reversal for Pi Network. As visible on the chart from TradingView, the MACD line (blue) crossed below the signal line (orange) on May 19. This crossover marks the first bearish signal in more than a month, indicating growing downward momentum.
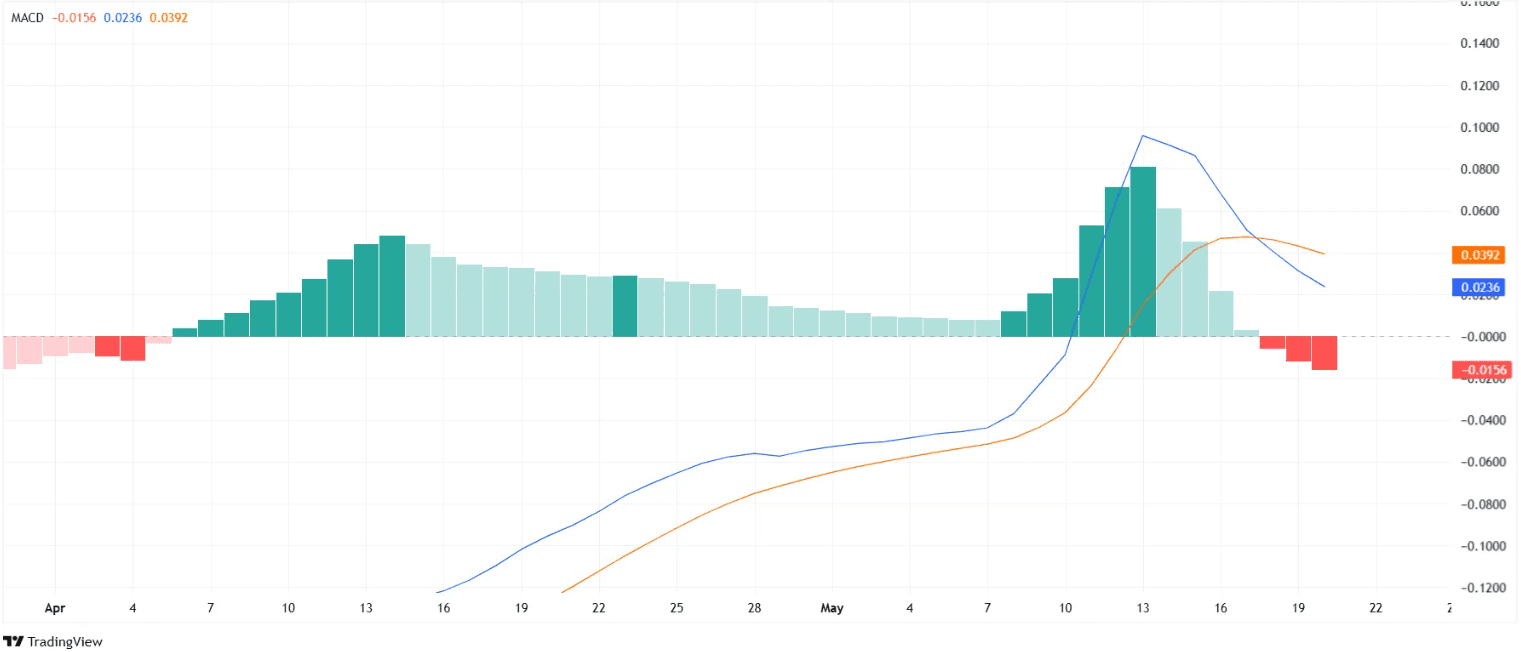
Before this shift, both MACD and signal lines had risen steadily through late April and early May. The histogram bars peaked around May 13, reflecting strong bullish momentum at the time. However, the histogram has since flipped into red territory, with values now below zero. This transition signals that selling pressure is increasing and that the short-term trend has reversed direction.
The MACD reading currently sits at -0.0156, reinforcing the bearish crossover. At the same time, Bitcoin continues to trade near its local highs, but Pi Network has failed to track its movement. This divergence suggests that Pi is not only decoupling from Bitcoin but also losing internal momentum.
The weakening MACD pattern aligns with falling investor confidence and may lead to further losses. Unless the indicator rebounds above the signal line and histogram bars return to positive territory, Pi Network remains exposed to more downside risk.
At the same time, investor confidence in Pi Network remains low. The asset’s inability to align with Bitcoin’s rally limits its exposure to fresh capital. In a market where most assets depend on major trend leaders, Pi Network now stands isolated.
Without external catalysts or a shift in market momentum, Pi Network may struggle to regain strength. The decoupling from Bitcoin removes a key source of support, leaving the project more vulnerable to negative developments.
