
On May 31, 2025, the TRON to U.S. Dollar (TRX/USD) 4-hour chart on Binance created a bearish rising wedge pattern.

A bearish rising wedge forms when the price moves inside two upward-sloping, converging trendlines, typically signaling a potential trend reversal and breakdown.
The TRX/USD chart shows the price consolidating between the red trendlines since early May. On May 30, TRX broke below the lower boundary of the wedge and dipped under the 50-period Exponential Moving Average (EMA), which currently stands at $0.2727.
At the time of the breakout, TRX traded near $0.2693. If the wedge confirms, the price can fall by approximately 12% from the current level. This move would place TRX near the $0.2356 zone—marked by the horizontal blue dotted line on the chart.
Volume during the breakdown showed a slight increase, suggesting rising selling pressure. The pattern invalidates if TRX reclaims the 50-period EMA and closes back inside the wedge structure.
If momentum continues downward, $0.2356 could act as the next key support zone.
TRX RSI Shows Bearish Momentum Below Key Threshold
The 4-hour Relative Strength Index (RSI) for TRON (TRX/USD), published on May 31, 2025, stands at 39.47, while its 14-period moving average is 45.71, according to TradingView.

The RSI, which tracks the strength and speed of price movements, has remained below the neutral 50 level. This confirms bearish momentum. After dipping near 35, the RSI bounced slightly, but the recovery lacked strength. The indicator remains well under its average, showing no signs of immediate reversal.
The RSI line staying below its moving average signals sustained downward pressure. Unless the RSI breaks above 50 and crosses its average from below, TRX is unlikely to regain upward momentum. This indicator supports the bearish breakdown observed on the price chart and aligns with a possible continuation toward lower support levels.
MACD Histogram Turns Negative, TRX Loses Bullish Momentum
The Moving Average Convergence Divergence (MACD) chart for TRON (TRX/USDT), published on May 31, 2025, shows weakening momentum. The MACD line (blue) is at 0.0041, the signal line (orange) is at 0.0053, and the histogram reads –0.0012.
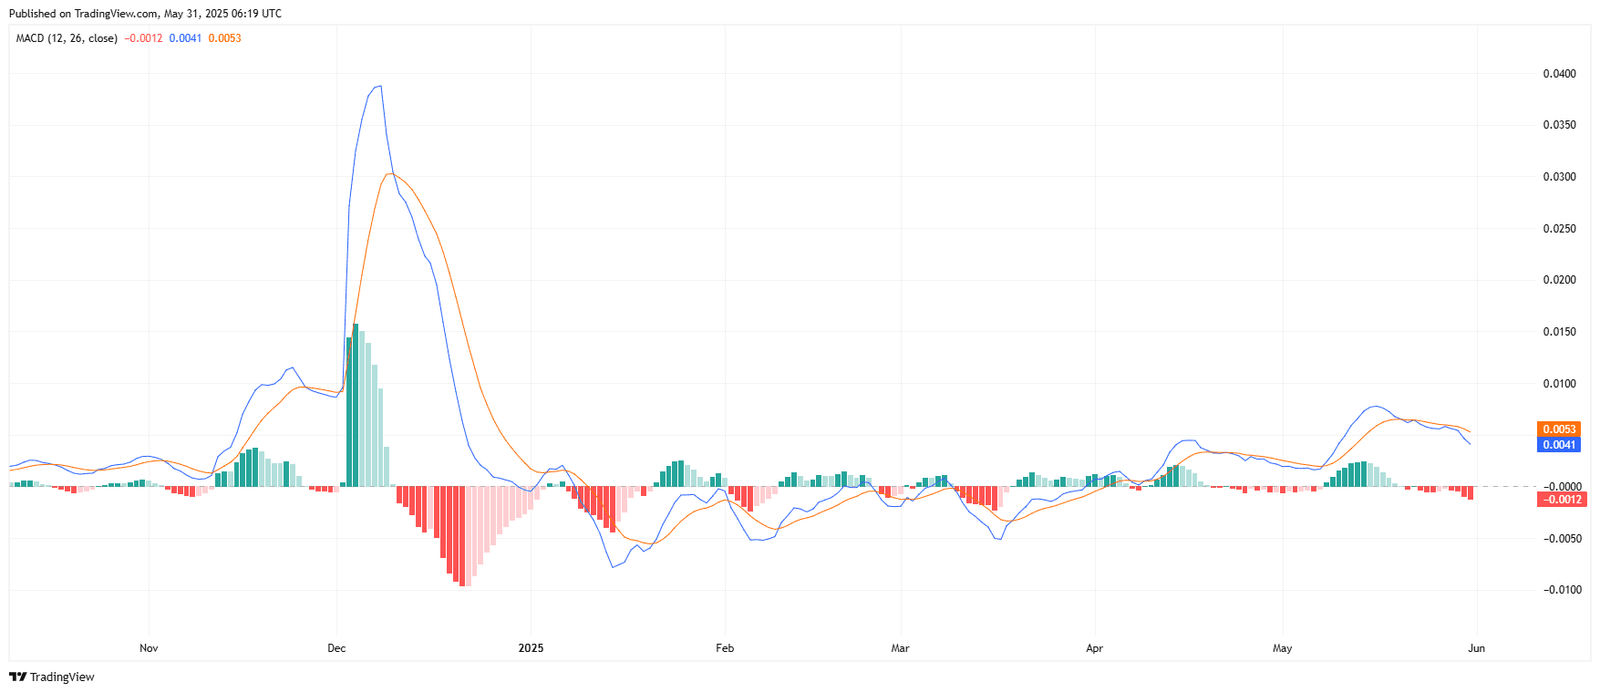
The MACD is a momentum oscillator that tracks the relationship between two moving averages. A bearish signal occurs when the MACD line crosses below the signal line, often indicating trend reversal or loss of strength.
In this case, the histogram has turned negative, confirming a bearish crossover. The MACD line is now falling below the signal line, suggesting TRX has lost its recent bullish momentum. The histogram bars have also dipped below zero, reinforcing the shift toward selling pressure.
Unless a bullish crossover reappears, the MACD setup aligns with the weakness shown on the RSI and price charts.
