
On June 4, 2025, Pi Network to Tether (PI/USDT) formed a falling wedge pattern on the 4-hour chart.
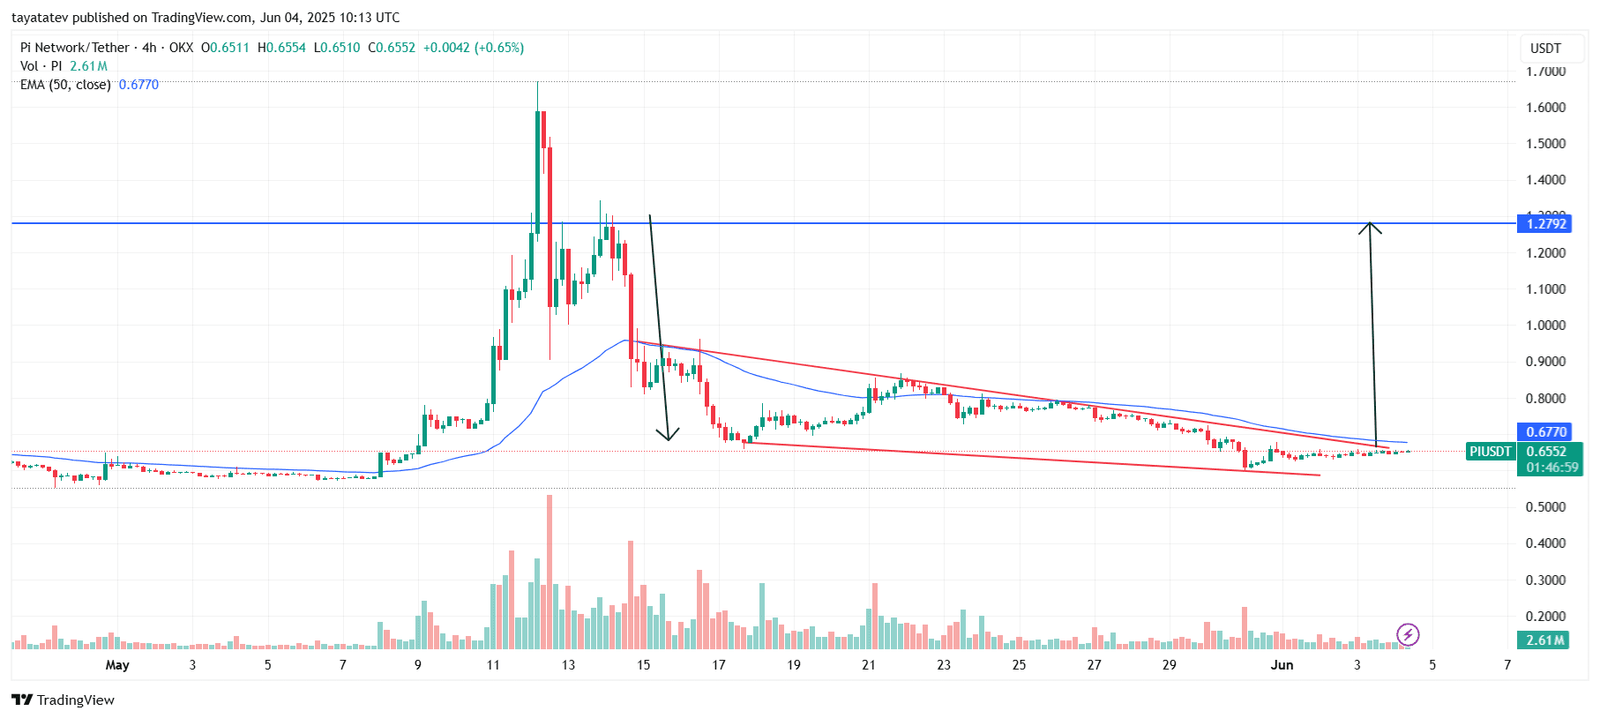
A falling wedge pattern appears when price moves between two downward-sloping, converging trendlines and typically signals a potential bullish reversal.
If the pattern confirms with a breakout above the upper red trendline, the price can rally 99 percent from the current price of $0.6552 toward the projected target of $1.2792.
Currently, the price trades slightly below the 50-period Exponential Moving Average (EMA), which stands at $0.6770. The price must break above both the wedge resistance and the EMA to activate the bullish setup.
Volume remains stable near 2.61 million, but the price has compressed into a tight range inside the wedge. This shows declining volatility and may hint at a breakout attempt.
For confirmation, traders will look for a strong candle close above the upper trendline, supported by increased volume. If that occurs, bullish momentum may drive PI/USDT toward the $1.27 area.
Directional Movement Index (DMI) Analysis – June 4, 2025
The chart shows the Directional Movement Index (DMI) for Pi Network to Tether (PI/USDT) on the 4-hour timeframe.
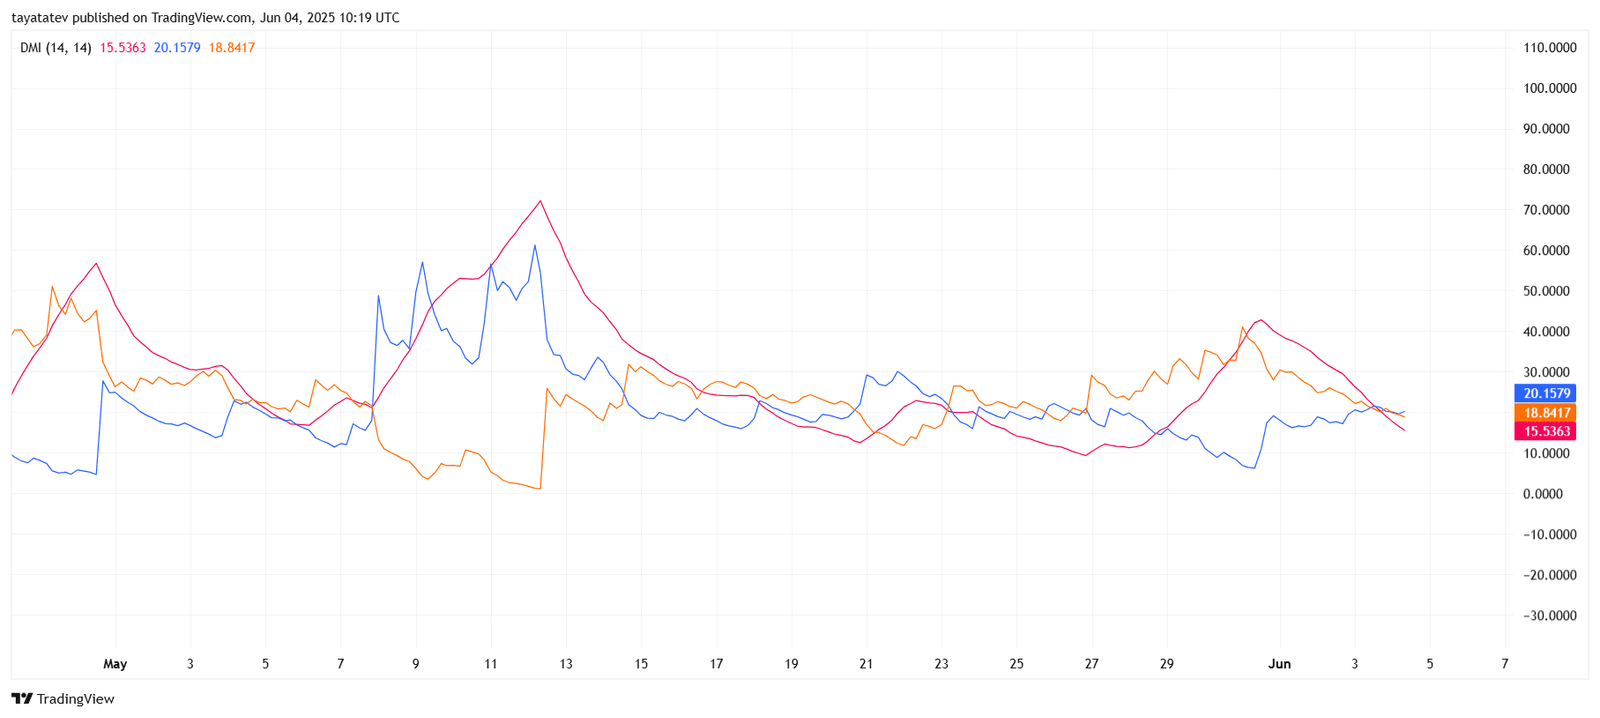
The DMI includes three key components:
+DI (Positive Directional Indicator) in blue: 20.15
–DI (Negative Directional Indicator) in red: 15.53
ADX (Average Directional Index) in orange: 18.84
The +DI line is now above the –DI line, showing that bullish strength is currently greater than bearish pressure. However, the ADX value remains below 20, indicating that the trend is still weak and lacks clear momentum.
Earlier in the chart, the –DI crossed above +DI around May 13, confirming a bearish trend that continued into the last week of May. Since then, the +DI has gradually climbed above the –DI, showing a potential trend reversal.
Still, the low ADX reading signals that this bullish shift needs stronger momentum to become a confirmed trend. For now, buyers have an edge, but volume and volatility must rise to support a sustained breakout.
PI/USDT RSI Shows Bullish Momentum Building
The chart displays the Relative Strength Index (RSI) for Pi Network to Tether (PI/USDT) on the 4-hour timeframe. The RSI (purple line) currently reads 49.36, while its 14-period moving average (yellow line) stands at 44.05.
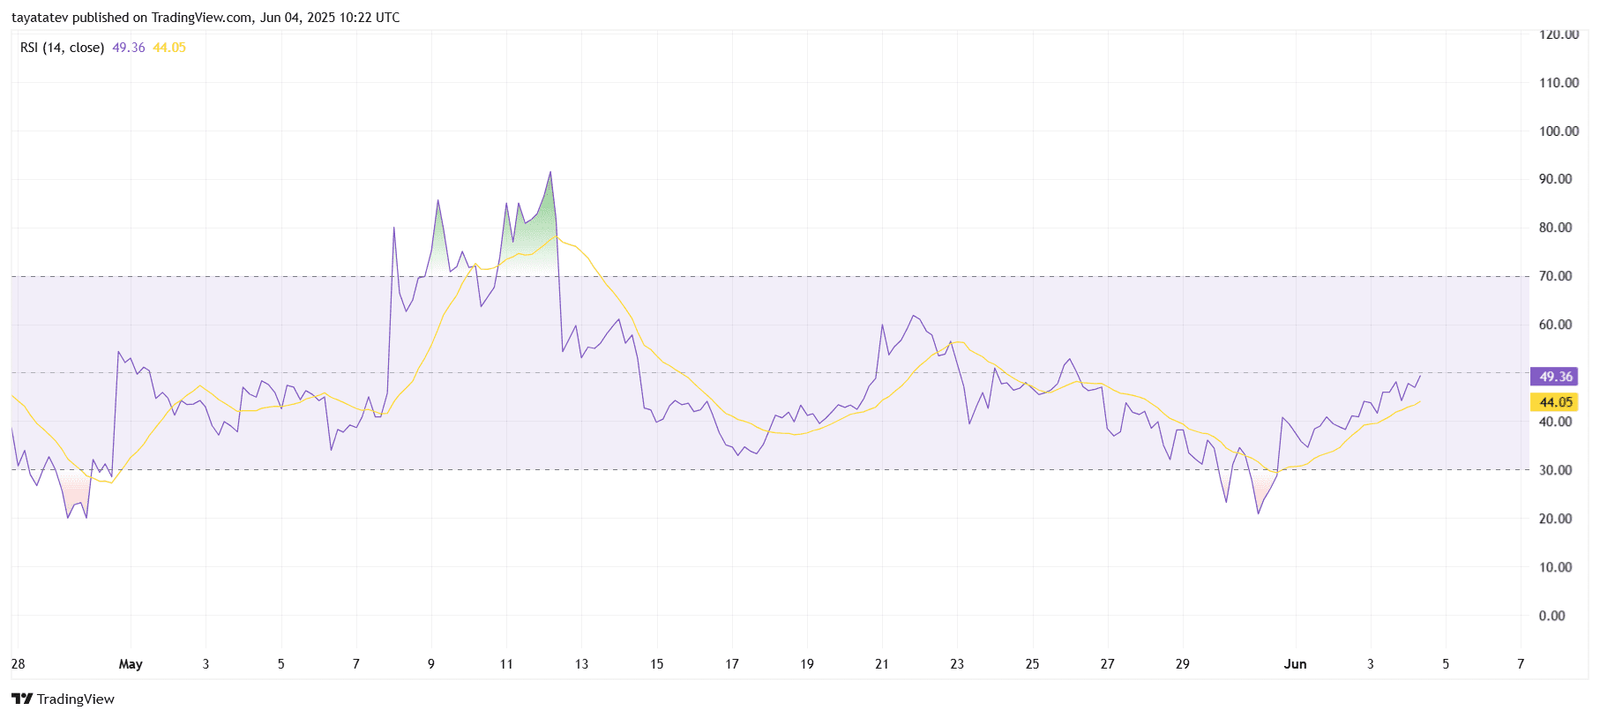
RSI measures momentum by comparing recent gains and losses. It typically signals overbought conditions above 70 and oversold conditions below 30.
Right now, the RSI is climbing toward the midpoint of 50, showing improving bullish momentum. Since RSI has crossed above its moving average and continues to rise, this signals a gradual shift in favor of buyers.
Earlier in June, RSI rebounded from near-30 levels, avoiding oversold territory. This bounce aligns with recent price stability and suggests potential for further upside if RSI continues above 50.
However, the RSI remains in neutral range. A confirmed break above 50 would strengthen the case for a bullish continuation.
PI/USDT SMI Signals Momentum Shift to the Upside
The chart shows the Stochastic Momentum Index (SMI) for Pi Network to Tether (PI/USDT) on the 4-hour timeframe. The blue line (SMI) stands at 34.39, while the orange signal line follows closely at 33.42.
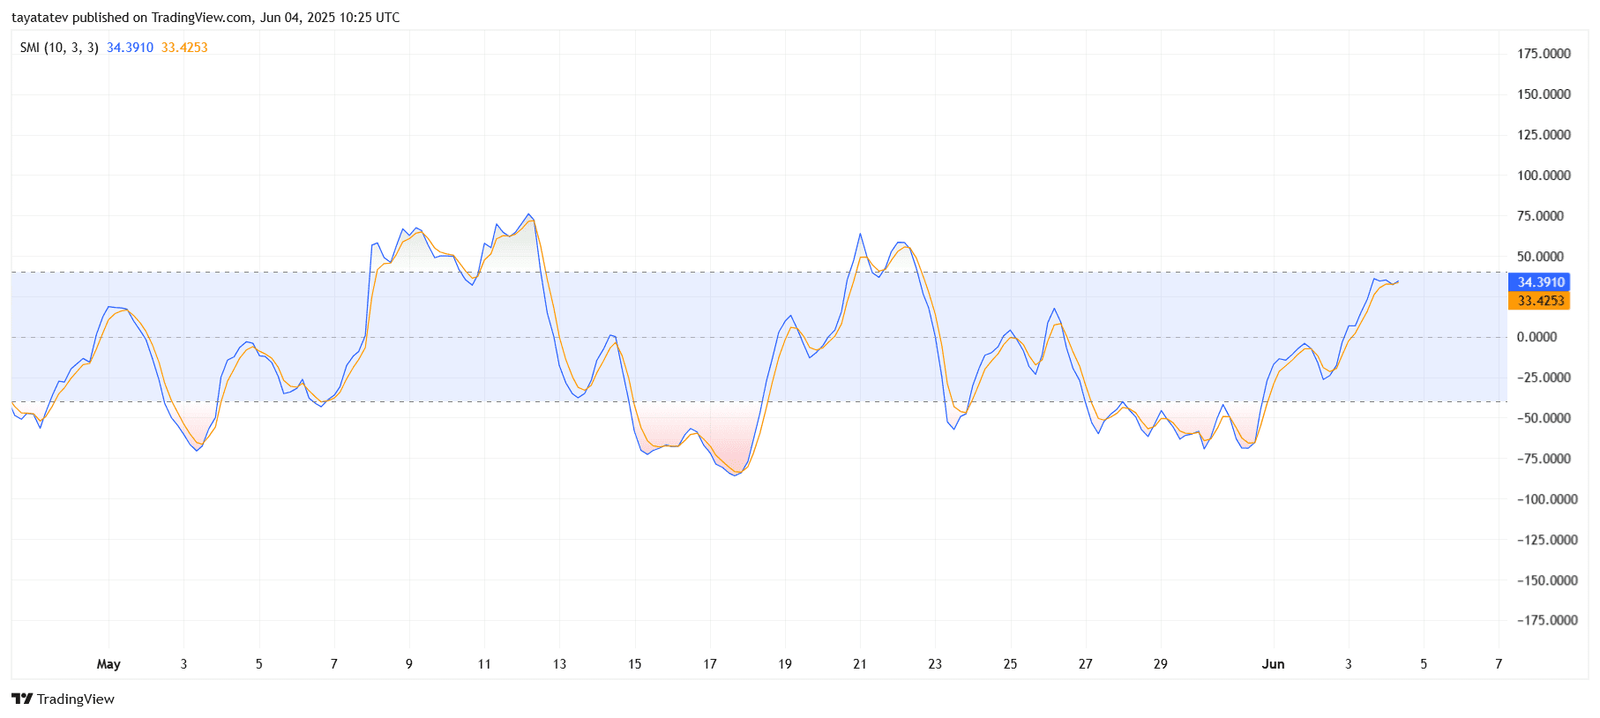
The SMI measures momentum relative to price range and works like an improved version of the stochastic oscillator. Values above +40 suggest bullish momentum, and values below -40 indicate bearish conditions.
Currently, both lines have crossed above the zero level and are approaching the +40 zone. This rise confirms growing upside momentum. The blue SMI line leads the signal line, showing bullish control.
Earlier in May, SMI made several failed attempts to hold above zero. But now, the smooth breakout suggests stronger buyer presence. If the indicator breaks and holds above +40, it would confirm a clear bullish momentum phase.
PI/USDT MACD Histogram Flips Green, Signals Early Bullish Shift
The chart shows the Moving Average Convergence Divergence (MACD) for Pi Network to Tether (PI/USDT) on the 4-hour timeframe. As of June 4, 2025, the MACD line (blue) is at –0.0053, and the signal line (orange) is at –0.0093, while the histogram has turned slightly positive at 0.0040.
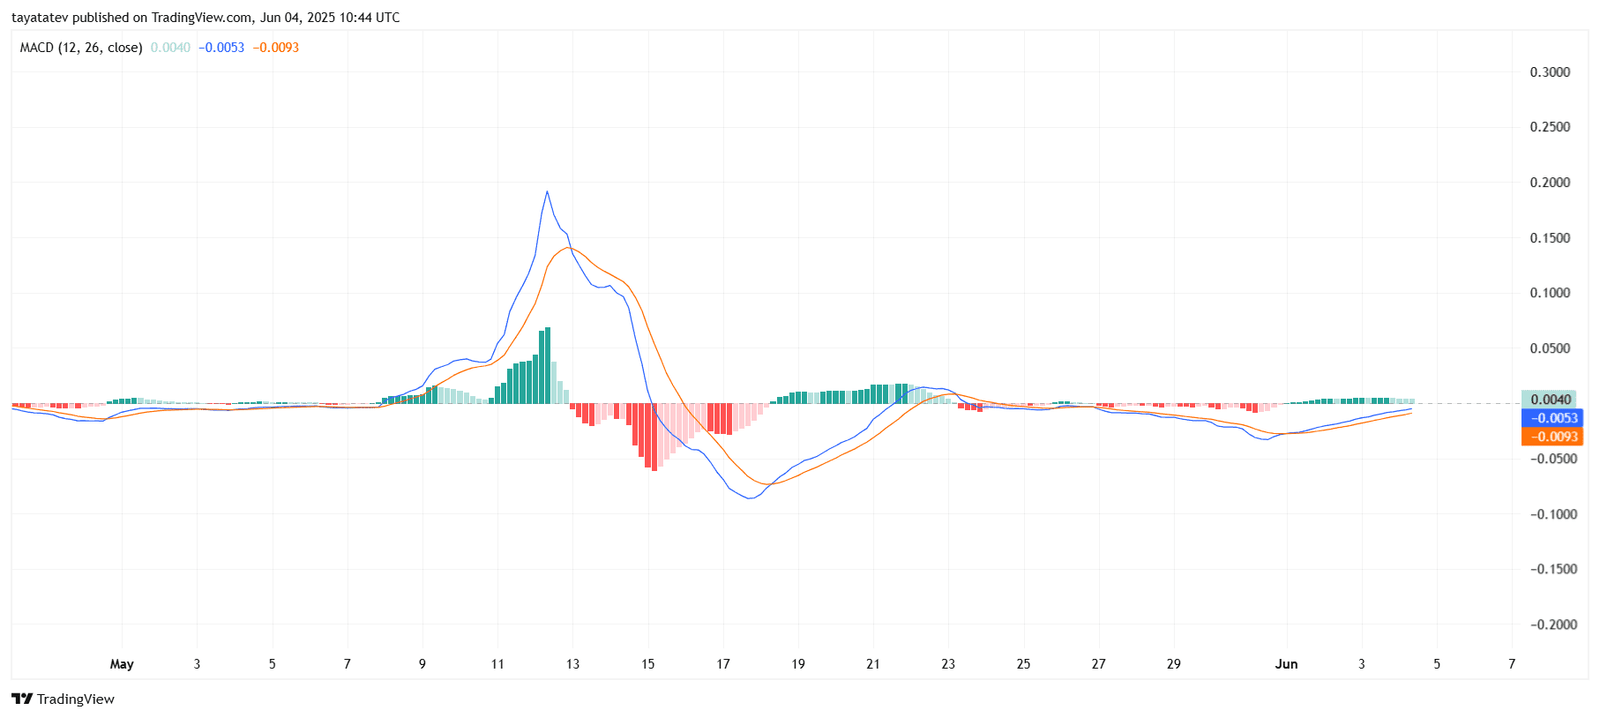
MACD identifies trend shifts and momentum strength. A crossover of the MACD line above the signal line indicates a potential bullish trend, especially when it happens below the zero line.
Currently, the blue MACD line is moving closer to crossing above the orange signal line, and the histogram bars are green and increasing. This signals early bullish momentum forming.
The last crossover occurred around May 10 during a strong rally. Now, the setup again shows early signs of a shift, with the histogram turning green and the distance between the lines narrowing. If the MACD line crosses above the signal line, it would confirm bullish divergence.
Pi Network Braces for June Token Unlock Worth $176 Million
Pi Network is preparing for a major token unlock in June, releasing 276 million PI tokens into circulation. At current market rates, the unlocked tokens are valued at approximately $176 million, according to data from PiScan.
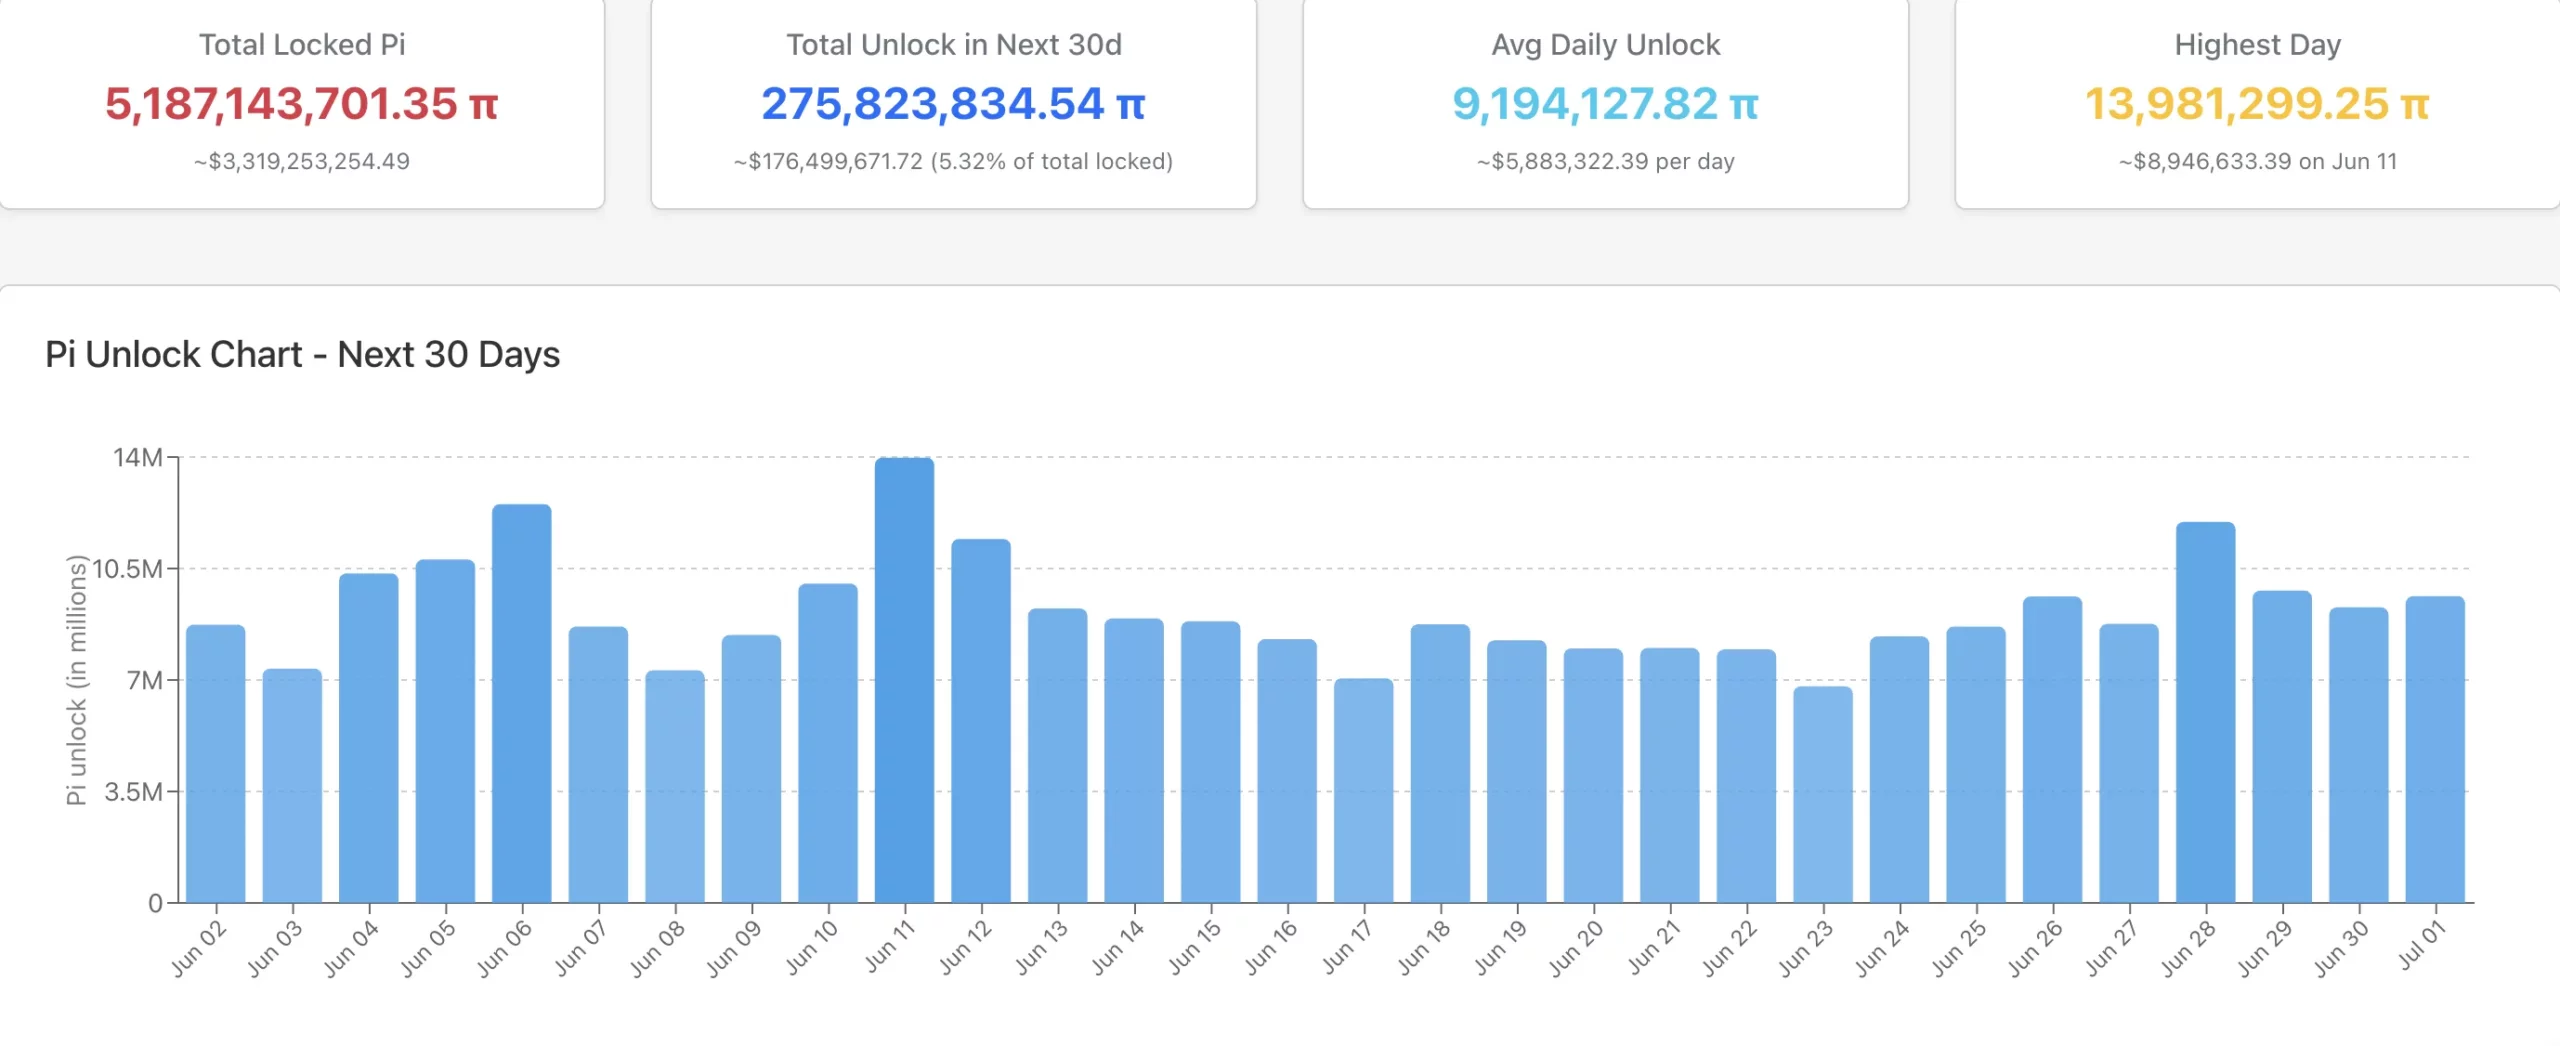
The event raises concerns among market participants already dealing with bearish sentiment and declining trading volume. The Pi Coin price has struggled to recover after recent losses, and this token unlock could further weigh on its performance.
Historically, large-scale token releases often introduce additional selling pressure, especially when overall demand remains weak. In Pi’s case, the timing appears unfavorable. Market conditions are already fragile, and the sudden increase in supply may accelerate a move toward lower price levels.
The Pi Network team has not publicly commented on the unlock’s market impact. However, investors continue to watch closely as the token release approaches, looking for signs of increased liquidity or early selloffs.
