Analysts have issued bullish projections for Shiba Inu (SHIB), with some forecasting a price range of $0.00017 to $0.00032 by Q4 2025. The upper target implies a potential 2,600% gain from the current level of $0.0000117. The predictions are largely based on the assumption that a breakout will occur following prolonged consolidation and increasing network adoption.
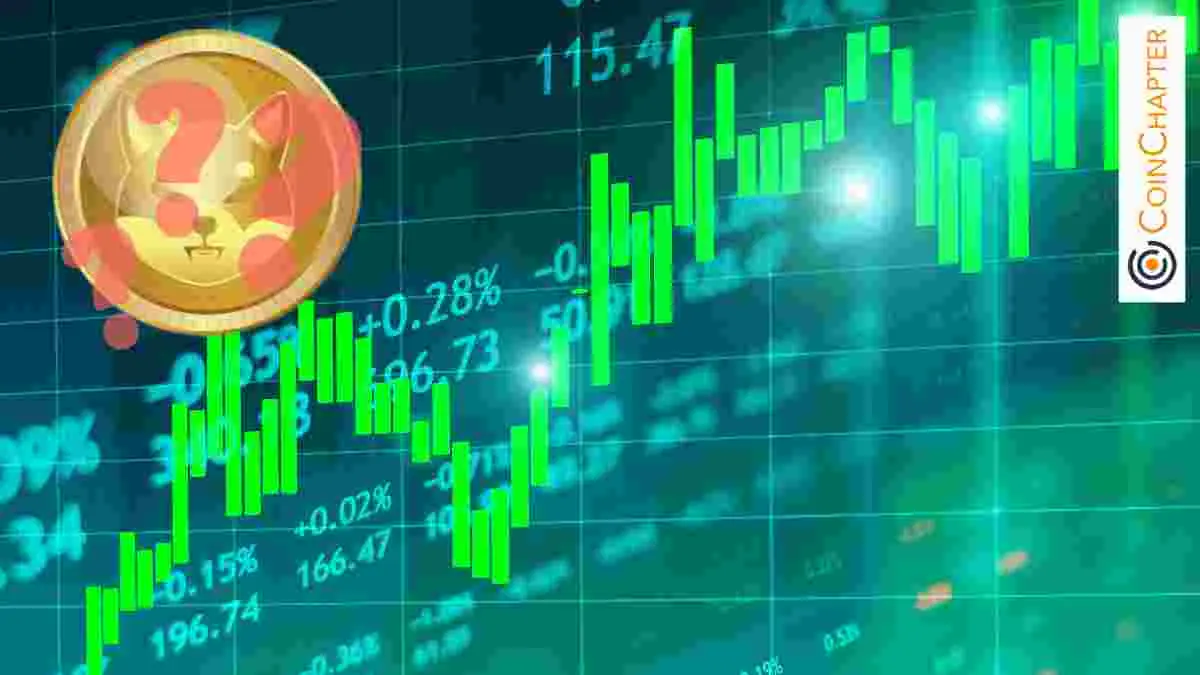
A TradingView chart shared by one trader shows that SHIB historically followed cyclical breakout patterns in 2022 and 2024, delivering returns of 1,218% and 400% respectively. Using these patterns, the analyst projected a 796% move in 2025, which could send SHIB to $0.00007827, a level not seen since late 2021.
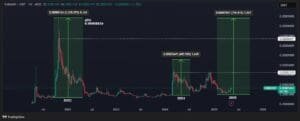
Another projection, shared by Crypto Twitter user @Crypto_Twittier, set a more modest price band of $0.00017 to $0.00032 for Q4 2025. This forecast appears based on technical patterns, historical RSI structures, and the assumption that SHIB can revisit its previous 2024 peak near $0.00003239 before extending further.
These analysts are relying primarily on historical chart behavior and speculative cycles common to meme coins. However, to determine whether such projections are viable, it is essential to evaluate current on-chain indicators and technical signals.
Shiba Inu Price Structure Shows Compressed Range Below Resistance
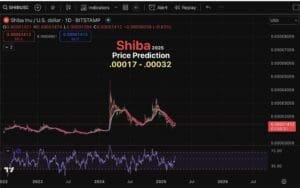
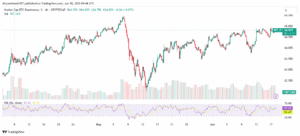
SHIB continues to trade beneath a descending trendline from May highs. The current price, around $0.00001167, remains just above short-term support at $0.00001032. RSI stands at 40.33, indicating subdued momentum. Volume remains inconsistent, and no breakout has occurred above resistance between $0.00001326 and $0.00001533.
Weekly charts show a key resistance level near $0.00001589. Unless SHIB closes above this level with strong volume, a technical breakout remains unconfirmed.
2025 Activity Lags Behind 2021 Rally Metrics
On-chain data shows a significant difference between current conditions and those seen in 2021. At the peak of the 2021 cycle, SHIB recorded over 108,000 daily active addresses and more than $45 billion in daily trading volume. As of June 2025, active addresses are under 9,000, and trading volume averages $1.2 billion. That reflects a 91.6% drop in network participation and a 97.3% decline in volume.
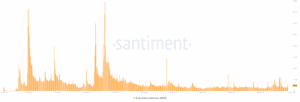
These metrics show that user activity and capital inflow remain far below 2021 levels.
Open interest in SHIB futures has decreased in June. Funding rates are neutral to negative across major exchanges. Liquidations have primarily affected long positions during sharp price dips. These data suggest that leveraged traders are not positioning for a strong bullish breakout at present.
Shibarium Usage Expands, But No Clear Link to Price Yet
Shibarium processes over 4.3 million transactions daily and has logged more than 265 million addresses. The protocol has also validated over 11.5 million blocks. Despite this scale, SHIB’s market price has not shown a consistent correlation with Shibarium metrics.
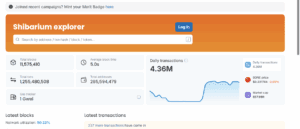
Burn data from Shibburn indicates a 364% increase in the past 24 hours, with more than 15.6 million SHIB tokens removed from circulation. However, with a circulating supply of over 589 trillion, these burns remain too small to influence price in the short term.
Bitcoin dominance currently stands at 64.82%, a level that historically restricts capital flow into altcoins. SHIB’s upward potential is likely to remain capped unless BTC stabilizes or a clear rotation into memecoins emerges.
BTC and ETH are both trading near local support zones. BTC’s RSI is at 42.99, while ETH sits at 44.91—both suggestive of continued caution. If these majors lose key support levels, SHIB may struggle to maintain current price levels, let alone advance.
Comparison With 2021 Shiba Inu Rally Shows Structural Gaps
While SHIB’s price structure shows similarities to its 2021 setup, several indicators shows weaker conditions in 2025. Volume and address activity are significantly lower. Derivatives markets show low commitment, and there is no viral community momentum comparable to that of the 2021 rally.
Despite the increase in infrastructure metrics, SHIB’s market price has not shown a consistent correlation with Shibarium activity. Technical resistance remains intact, and no breakout has been confirmed across higher timeframes.
