Sui (SUI) price started a downside correction from the $4.30 zone. It is now approaching the key support at $2.50, where the bulls might emerge.
SUI Price Dips Below $3.00
In the last technical analysis, we discussed the chances of more gains in SUI after it cleared the $3.00 resistance zone. The bulls did remain in action and pushed the price above the $4.00 resistance zone. However, the bears were active near the $4.30 zone.
A high was formed at $4.29 and the price started a downside correction, underperforming Bitcoin and Ethereum. There was a move below the $4.00 and $3.50 support levels. SUI price dipped below the 50-day simple moving average (blue), and the 50% Fib retracement level of the upward move from the $1.719 swing low to the $4.291 high.
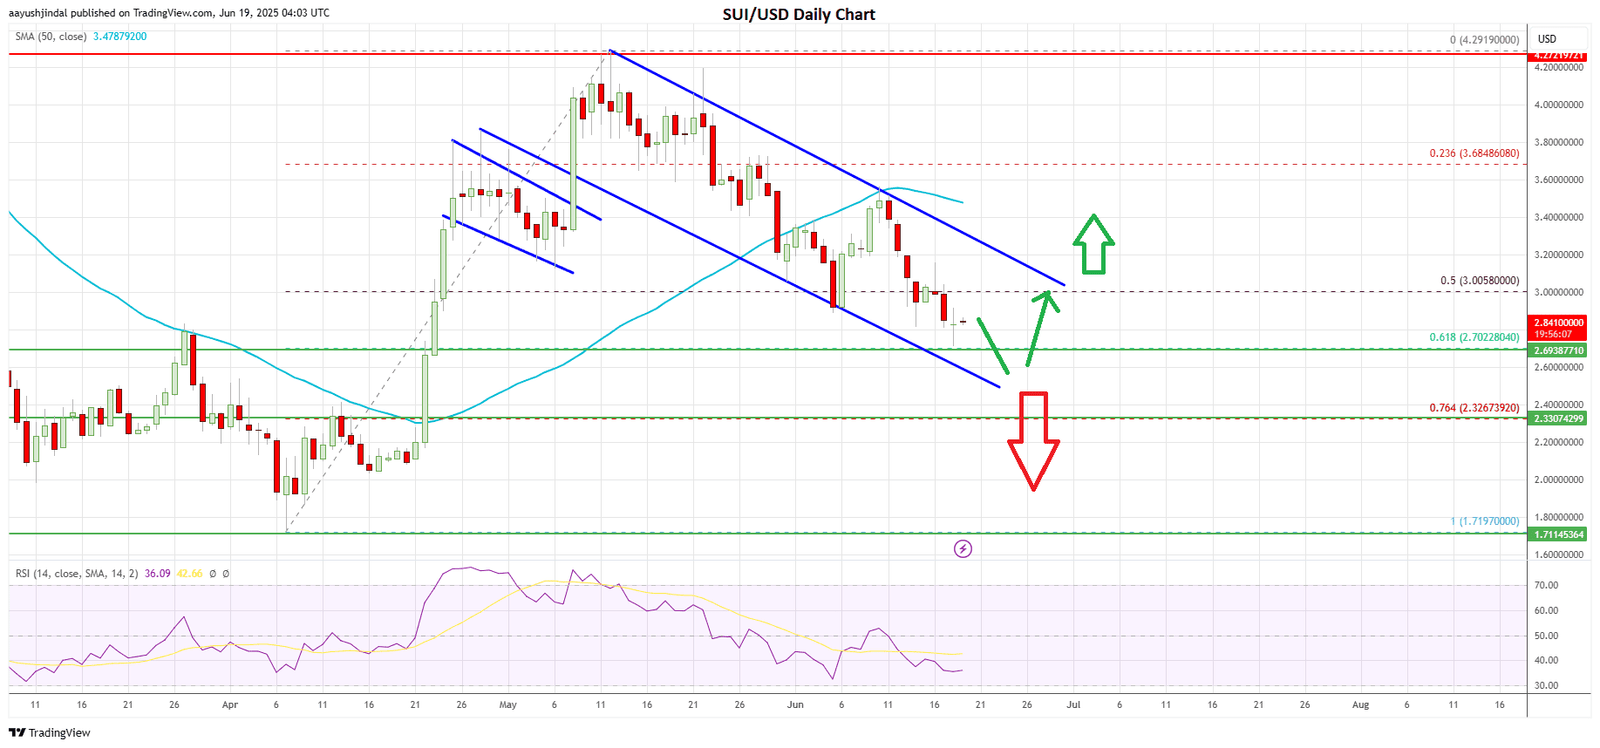
SUI is now trading below the $3.00 pivot level and the 50-day simple moving average (blue). However, there are many important support levels on the downside waiting to hold losses.
Immediate support is near the $2.70 level. It is close to the 61.8% Fib retracement level of the upward move from the $1.719 swing low to the $4.291 high. The first major support is near the $2.50 zone. The next key support seems to be forming near the $2.320 level.
If the bulls fail to protect the $2.320 support, there could be an extended decline. In the stated case, the price could dip and test the $2.20 support zone. The main support is now forming near the $2.00 zone. A daily close below the $2.00 support could trigger a major drop. In the stated case, the price could dive and test the $1.720 support.
Any more losses might send the price toward the $1.120 support and the 1.236 Fib extension level of the upward move from the $1.719 swing low to the $4.291 high.
Fresh Increase From $2.50 or $2.32?
If the bulls remain active above the $2.320 support, SUI could see another increase. Immediate resistance sits near the $3.00 level. The first major resistance is near the $3.20 zone. There is also a declining channel forming with resistance at $3.20 on the daily chart.
A close above the $3.20 level could spark a steady increase. The next major resistance could be $3.50 and the 50-day simple moving average (blue). A clear move above the $3.50 level could accelerate gains. In the stated case, the price could rally and test the $4.00 level. Any more gains might send the price toward the $4.30 resistance zone.
Overall, SUI price is approaching the key support at $2.50. If the bulls fail to protect the $2.50 and $2.320 support levels, there could be a medium-term shift in the trend.
