
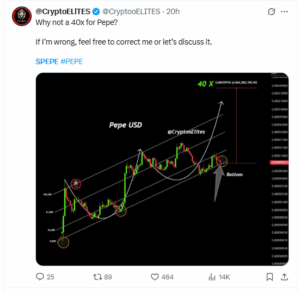
Crypto influencers like @CryptoELITES and @JakeGagain have published bullish projections on social media. One chart shared by @CryptoELITES outlines a long-term trend channel suggesting that PEPE is currently at a local bottom, with the next major leg pointing toward a 40x gain — which would push the price near the $0.0004 range.
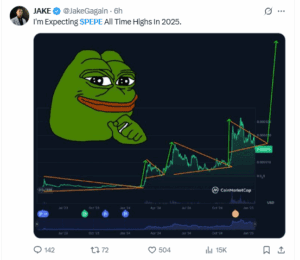
Similarly, @JakeGagain posted a chart highlighting a multi-month ascending pattern, arguing that PEPE could reach new all-time highs before the end of 2025.
Both projections rely on historical trend channels and chart-based continuation setups. However, current market indicators do not confirm the start of a sustained upward move.
PEPE Price Trades Below EMAs, RSI Remains Subdued
PEPE is trading at $0.00001041 as of June 19. The chart shows a descending wedge pattern forming after the early May rally. This structure suggests potential consolidation, but not yet a confirmed breakout. PEPE price is compressing below the 20 EMA ($0.00001096), 50 EMA ($0.00001111), 100 EMA ($0.00001134), and 200 EMA ($0.00001141). This alignment shows sustained bearish pressure across all major timeframes.
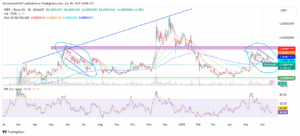
Strong resistance sits between $0.00001134 and $0.00001200, marked by previous rejection zones and intersecting EMAs. Price attempted to break into this band in late May but failed to hold above.
The RSI on the daily chart currently reads 40.60, with the signal line at 45.29. Both remain below the neutral 50 level. This indicates weak momentum. RSI has remained under 50 for most of June, aligning with broader trend weakness.
The current falling wedge closely resembles a similar structure from June–August 2024, where PEPE also failed to break key resistance after a strong move up. In that period, the token lost over 40% from the wedge apex before stabilizing.
The same setup is now visible, with a lower high forming below major resistance. Unless PEPE breaks the wedge’s upper boundary and reclaims $0.0000115, the pattern risks repeating.
Whale Activity and Exchange Data Remain Conflicted
Recent on-chain data shows increased activity among large wallets. Whale transactions above $100,000 rose 73% in the last 24 hours. Total whale transaction volume reached over $141 million. At the same time, large-holder net inflows increased from 81 billion PEPE to 125 billion.
Whale withdrawals from exchanges also spiked. On June 18, two wallets withdrew over 1.79 trillion PEPE, valued between $22 million and $27 million. These withdrawals reduce available supply on exchanges, often interpreted as accumulation.

However, not all whale behavior suggests bullish intent. One wallet, identified as 0x6ea4, sent 600 billion PEPE back to Binance on June 18. On-chain data shows this address took a $3.5 million loss. Previous whale deposits to exchanges have also preceded short-term price drops. A 609 billion deposit on June 13 triggered a 3.7% decline within 24 hours.
Open interest in PEPE futures remains elevated. However, funding rates have turned negative multiple times in June. A negative funding rate means traders with long positions are paying funding to short sellers. This shows that the derivatives market continues to lean bearish.
Trading volume has increased alongside open interest. Despite this, price has not broken resistance. This divergence suggests that volume may reflect volatility and not directional conviction.
Technical and on-chain data do not confirm a rally. Price remains below short-term resistance levels. Momentum indicators are weak. Funding data shows short-side pressure. Whale activity shows mixed intent, with accumulation and exchange deposits occurring simultaneously.
For bullish momentum to gain support, PEPE must close above the 50 EMA at $0.00001094 and reclaim $0.0000114. RSI must also move above 50. Until those signals appear, the market structure favors consolidation or downside continuation.
