Polkadot (DOT) is forming a falling wedge pattern on the weekly chart, similar to the setup that preceded a 171% breakout in 2024. However, the current trend is still bearish, and confirmation of a breakout has not yet emerged.
DOT Trades Below $3.60 Amid Weak Momentum
As of June 20, DOT is priced at $3.53, down over 7% in the past week. The token has failed to sustain gains above the 20-day EMA and now trades below all major moving averages on the 4-hour and daily charts. RSI has also dropped near 30, indicating oversold conditions, yet no reversal has followed.
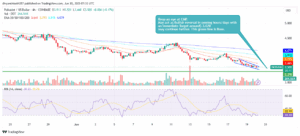
Volume also continues to weaken. 24-hour trading volume declined 17% to $201.7 million, showing lower spot activity and a lack of conviction among buyers. The current structure places DOT in a consolidative phase within the wedge, without confirmation of a breakout.
2024 Pattern Projected 171% Rally—is it Repeating?
A weekly fractal shared by analyst @nileshrh73 shows Polkadot forming a similar falling wedge pattern that occurred in Q2 2024. In that instance, DOT broke above the structure in late May and rallied from around $3.58 to over $9.70—an increase of more than 170% within six weeks.
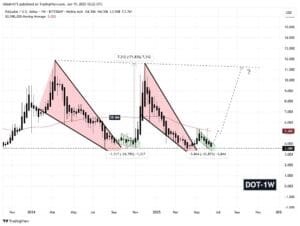
The current wedge is nearing its apex, with support at $3.50 and key resistance at $3.91. A breakout above the upper trendline could revive a bullish case, potentially aiming for the $9–$10 zone again. However, the setup remains speculative without a clear move above resistance backed by volume. Yet technical patterns alone are insufficient without confirmation from derivatives data
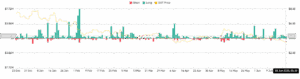
Open interest has risen to $458 million, suggesting increased leveraged trading, but persistent negative funding rates confirm dominance of short positions. Traders are paying to maintain bearish exposure, anticipating further downside.
You May Also Like: 21Shares Seeks SEC Approval for Spot Polkadot ETF
Additionally, long liquidations have picked up, with recent spikes in forced selling. The lack of short squeezes indicates the market still favors bearish positioning.
Staking Holds Steady with 53.5% of DOT Locked
While derivative markets suggest caution, staking and validator participation have remained steady. Around 53.5% of DOT’s total supply is currently staked. This figure remains just above the network’s ideal staking rate of 52.5%, keeping yields attractive without increasing inflation risk. Current APRs range between 11% and 14%, incentivizing long-term holding over active trading.
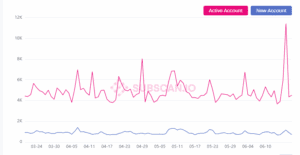
However, new account creation has remained stagnant. Daily new accounts have hovered below 2,000, while active accounts average around 4,000 to 6,000. This indicates ongoing participation from existing users but little new user growth—limiting short-term demand.