
Byreal, a new on-chain liquidity platform for real-world assets, officially launched on the Solana blockchain. Backed by crypto exchange Bybit and supported by the Solana Foundation, the platform aims to reshape decentralized finance (DeFi) by offering deep liquidity, trader-focused tools, and support for quality projects.
Focus on Quality, Liquidity, and Trader Experience
Byreal plans to serve both retail and institutional users. It focuses on solving DeFi’s recurring problems, including a lack of accountability and the dominance of short-term projects. The platform promises high execution speed, curated listings, and tools designed to match centralized exchange performance—all while staying true to DeFi principles.
It introduces deep liquidity by linking blue-chip and real-world assets with Solana’s fast, composable architecture. This approach ensures smooth trading and expands the usability of on-chain capital markets.
The Solana Foundation welcomed Byreal’s launch, noting the alignment with Solana’s broader goal to improve liquidity infrastructure and bring capital market assets on-chain. The foundation recognized Byreal’s commitment to building accessible, efficient, and composable DeFi tools.
New Products Introduced With Launch
Byreal introduced three products at launch: a decentralized exchange (DEX), a launchpad, and a yield vault.
The DEX uses a smart-routing engine that combines concentrated liquidity market makers (CLMM) with request-for-quote (RFQ) features. This setup enables zero slippage, gasless trades, and MEV protection—executing transactions in under 200 milliseconds.
The launchpad, called Reset Launch, aims to bring fairness and transparency to token launches. It includes tools like a Smart Price Ladder, Fairshare Engine, and price-based allocations. These tools replace airdrop farming tactics with more structured and transparent participation models.
The Revive Vault offers frictionless yield strategies. It includes bbSOL-only vaults, diverse ecosystem options, and integrated yield flows. With this vault, users can deploy capital across Solana efficiently while earning returns from both on- and off-chain strategies.
Together, these products form a unified growth engine. Byreal provides a full-cycle solution that combines asset discovery, trading, and yield generation within one interface. It integrates real assets, dual liquidity systems, and institutional-grade execution to support multiple blockchain ecosystems.
Solana Forms Bullish Flag Pattern, Eyes Potential 96% Rally
Solana (SOL) formed a bullish flag pattern on the daily chart as of June 22, 2025. A bullish flag is a continuation pattern that appears after a strong upward move and consists of a downward-sloping channel. It often signals that the prior uptrend may resume once the pattern breaks to the upside.
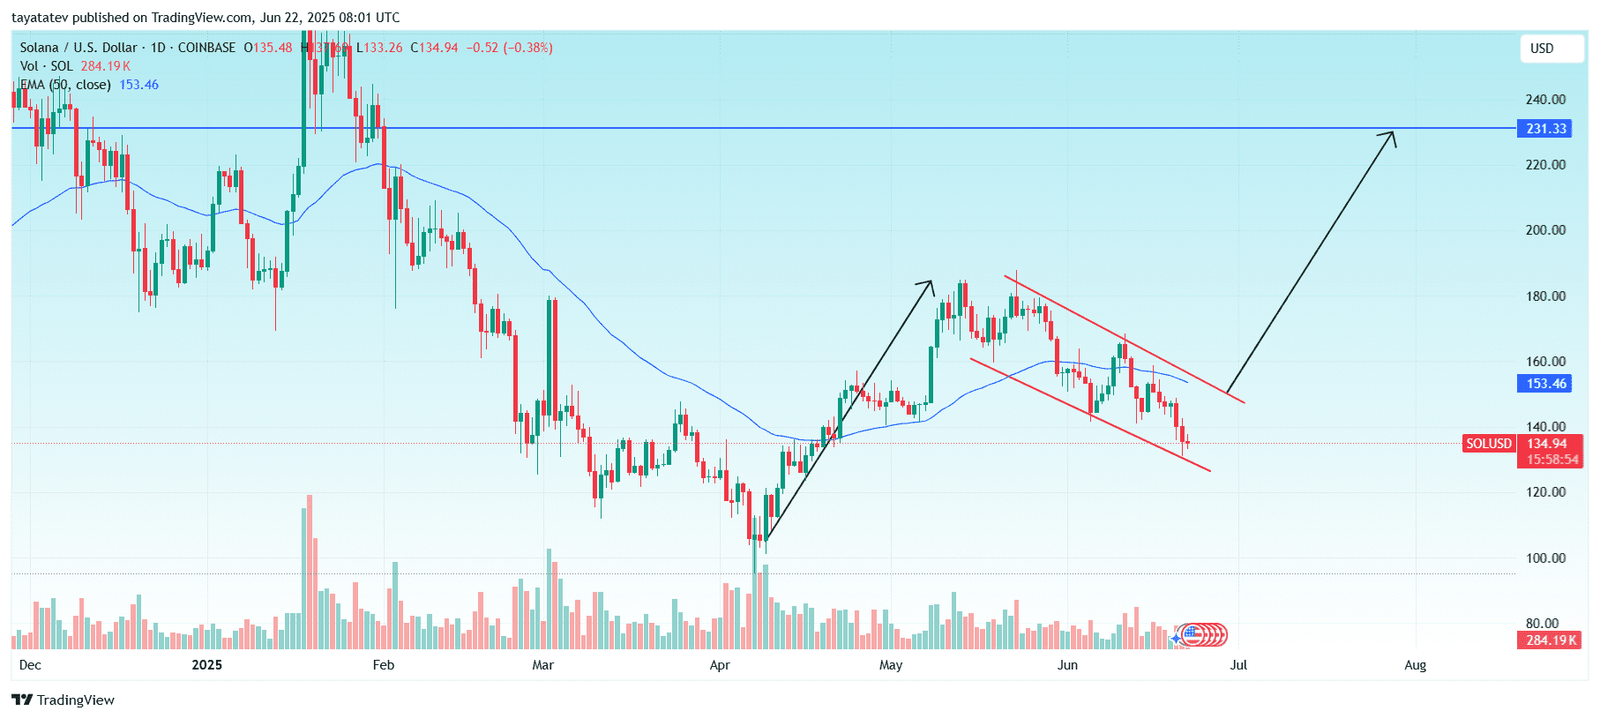
The chart shows SOL surging in April, then consolidating downward between two parallel red trendlines. This structure fits the bullish flag criteria: a steep rally (flagpole) followed by a downward-sloping channel (the flag). The pattern developed while SOL stayed above key support and tested the 50-day exponential moving average (EMA), currently at $153.46.
If Solana confirms this bullish flag breakout, the price could climb approximately 96% from the current level of $134.94. That move would project a target around $264, based on the height of the initial flagpole added to the breakout point.
For confirmation, traders typically wait for a daily close above the flag’s upper boundary, ideally with rising volume. A breakout above the $153.46 EMA could serve as the first trigger.
Solana RSI Signals Weak Momentum Near Oversold Zone
Solana’s Relative Strength Index (RSI) dropped to 33.46 on June 22, 2025, while the RSI moving average stands at 42.97. The chart shows sustained downward pressure since early June.
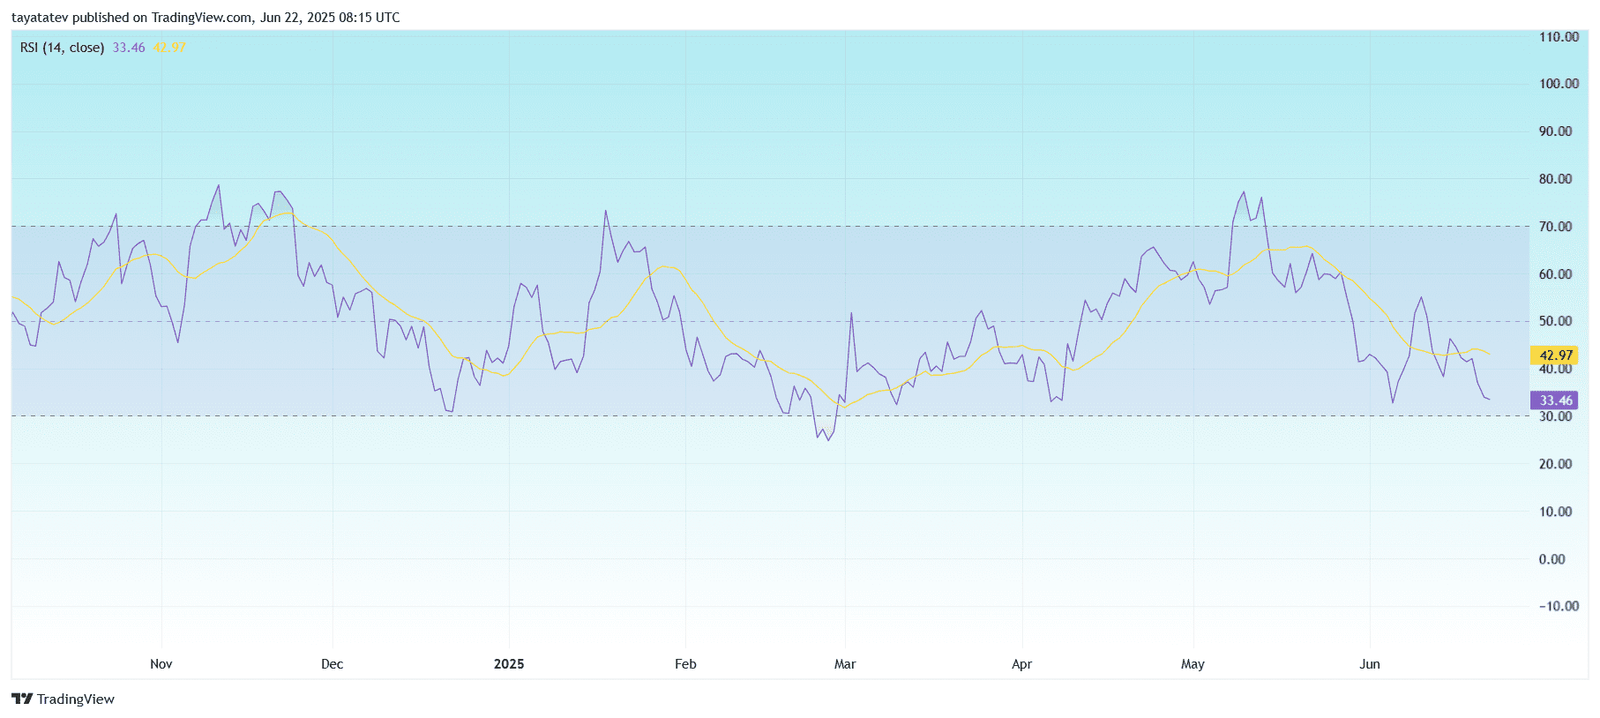
The RSI, a momentum indicator that measures the speed and change of price movements, ranges from 0 to 100. Levels below 30 suggest oversold conditions, while readings above 70 indicate overbought levels. Solana’s RSI currently sits close to the oversold zone, signaling weakening buying strength and increasing downside risk.
The RSI line remains below its moving average, reinforcing the bearish momentum. Each attempt to rebound has failed to cross above the 50 level since mid-May, showing persistent selling pressure.
If the RSI dips below 30, it may signal that Solana has become technically oversold, which sometimes precedes a short-term reversal. However, for trend reversal confirmation, RSI would need to reclaim the 50 level and break above the moving average. Until then, bearish conditions remain dominant.
Solana Trades Below Cloud With Bearish Signals Dominating
Solana (SOL) continues to trade below the Ichimoku Cloud, reinforcing a bearish outlook. The price remains inside a downward-sloping channel, with the cloud acting as resistance.
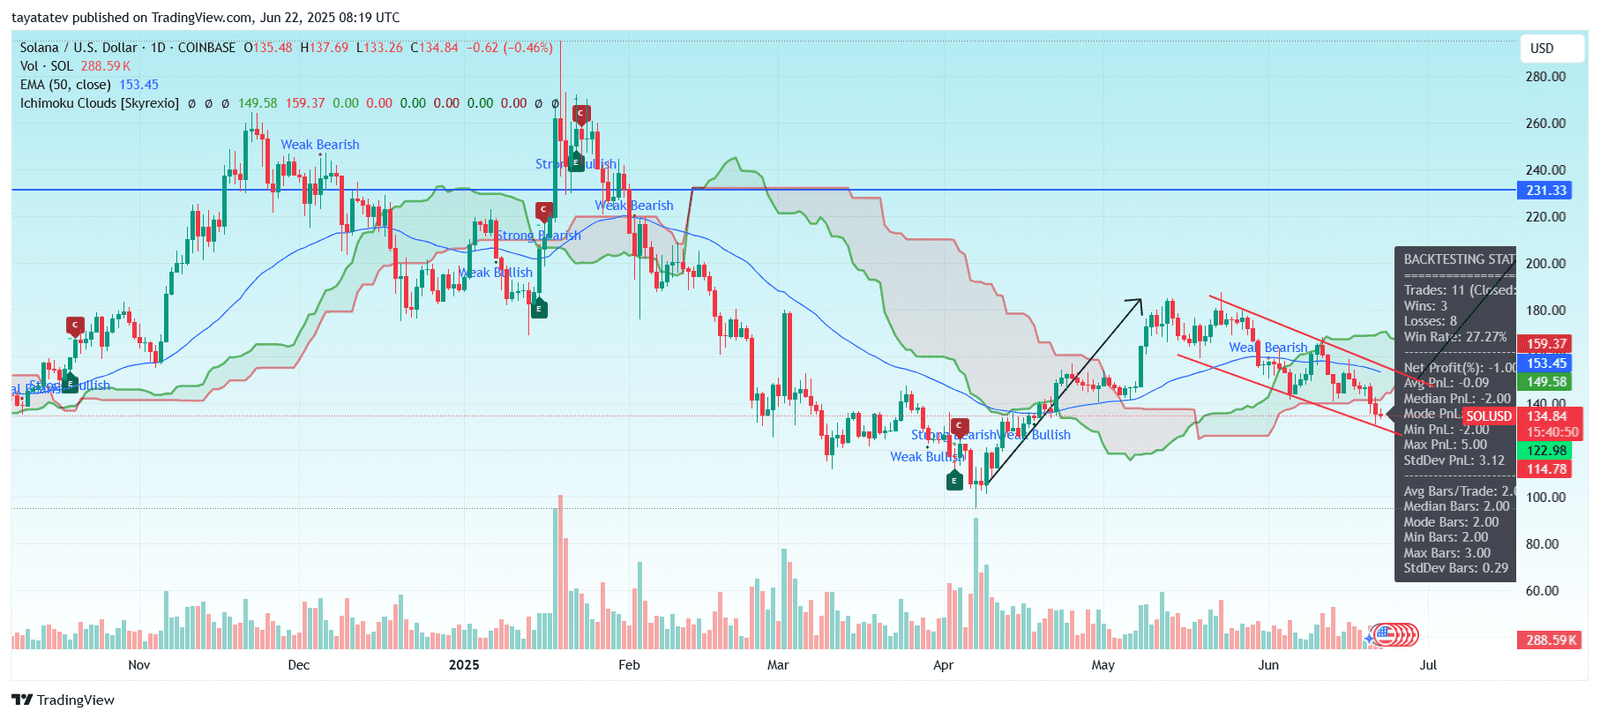
Multiple “weak bearish” signals appeared after the recent drop, following a short-lived “strong bullish” rally in April. These signals came as SOL broke below the cloud and failed to regain upward momentum. The price has remained suppressed under the red cloud area, indicating resistance ahead.
Although Solana attempted a breakout in late April and early May, the rally lost strength. The current setup still shows red cloud structure ahead, which suggests continued downside risk unless SOL breaks and holds above the cloud zone.
SOL’s price action stays locked inside a red descending channel, matching the broader bearish sentiment. Without a shift in trend structure, traders may continue to see pressure on the downside. For bullish confirmation, a strong move above the cloud and channel top would be required.
Solana DMI Shows Weak Trend Strength and Bearish Control
The Directional Movement Index (DMI) shows a weak trend with bearish signals taking control. As of June 22, the -DI (red) sits at 19.03, above the +DI (blue) at 15.01, while the ADX (orange) reads 28.64.
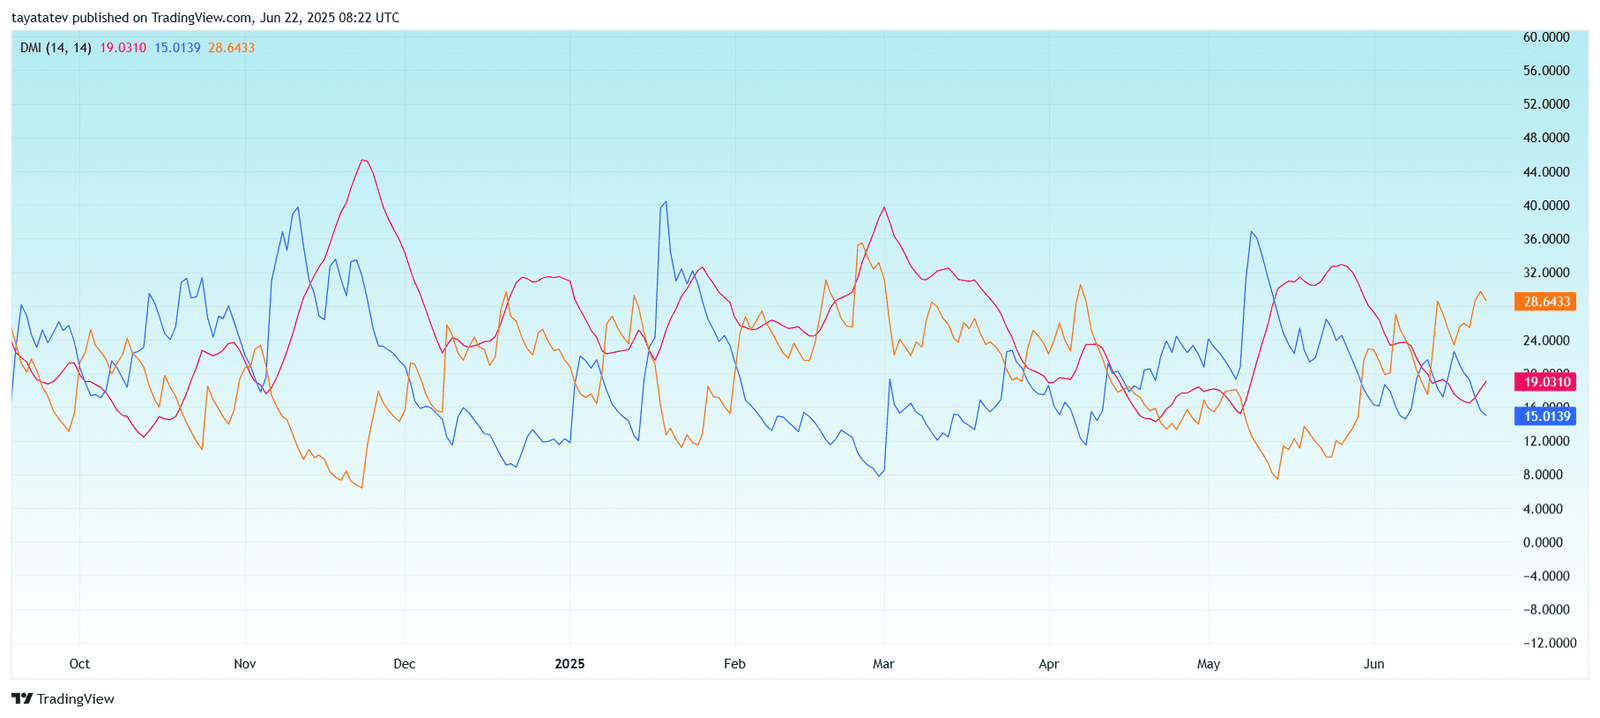
The DMI reveals a bearish crossover, with the negative directional index (-DI) overtaking the positive directional index (+DI). This setup indicates that downward momentum currently dominates the market.
The average directional index (ADX) climbed above 25, confirming that the current trend—although bearish—is gaining strength. This suggests sellers are in control and the downtrend may continue unless the DMI lines reverse positions.
The ADX is rising, but with -DI above +DI, the setup favors more downside. For a reversal, +DI needs to break above -DI and ADX should remain elevated to confirm new trend strength. Until then, the structure supports a bearish continuation.
