
Ethereum (ETH) dropped sharply after the Middle East conflict escalated. The United States launched precision strikes on Iran’s nuclear sites—Fordow, Natanz, and Isfahan—prompting Iran to retaliate with missile attacks and threats of a broader war.
As tensions rose, ETH fell 5% to $2,270.86 and recorded a 6.4% loss over 24 hours. At the same time, trading volume jumped to $21.6 billion as risk-off sentiment and market volatility intensified across the crypto sector.
ETH remains the second-largest cryptocurrency by market cap, now at $274 billion, with 120.7 million tokens in circulation. While geopolitical headlines dominate, technical indicators still offer key signals for traders.
Ethereum Forms Bullish Flag on Weekly Chart, Signals 112% Upside Potential
As of June 22, 2025, Ethereum (ETH) is trading at $2,262. The weekly chart shows that ETH has created a bullish flag pattern, a continuation setup where a sharp price rally forms a flagpole, followed by a downward-sloping consolidation channel (the flag).
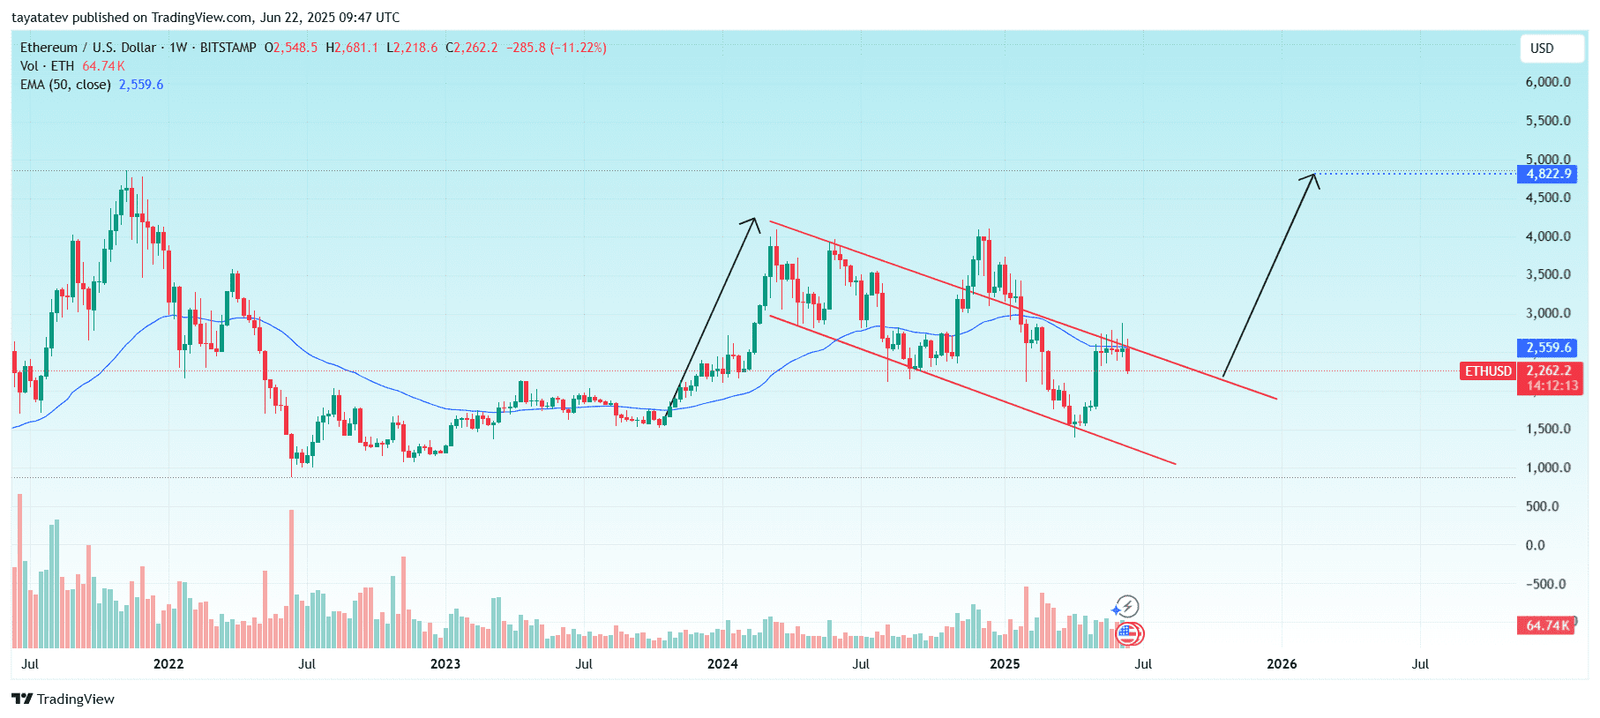
This pattern typically indicates that the prior uptrend may resume once the price breaks above the flag’s upper boundary.
If ETH confirms this bullish flag breakout, the measured move from the flagpole projects a potential 112% rally from the current level. This puts the target price near $4,822, which also aligns with a previous local high.
ETH must first reclaim the 50-week EMA at $2,559 and close above the flag’s upper trendline to validate the breakout. Once confirmed, this technical structure could drive a sustained move toward new highs.
Ethereum Trend Signal Remains Weak as DMI Shows Indecision
The Directional Movement Index (DMI) on Ethereum’s weekly chart signals trend indecision. The red ADX line reads 22.98, which remains below the key 25 threshold. This suggests that Ethereum does not currently exhibit strong trend momentum in either direction. The ADX line reflects the strength of the prevailing trend but not its direction, and values under 25 often indicate consolidation or a choppy market.
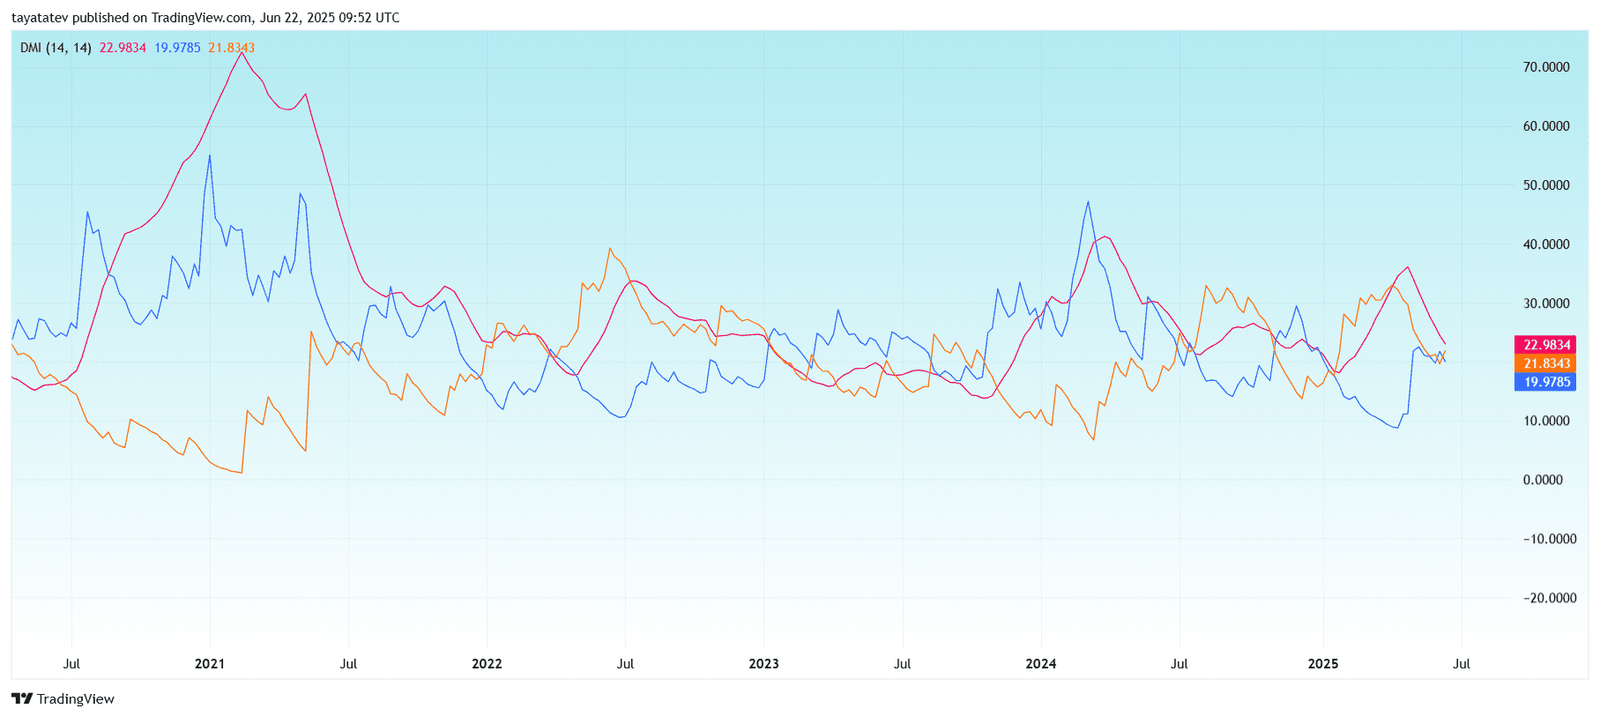
Meanwhile, the orange +DI line stands at 21.83 and is slightly above the blue −DI line, which is at 19.97. This small gap points to mild bullish pressure, but not enough to confirm a strong uptrend. For a clear directional signal, the +DI needs to rise further above the −DI while ADX also climbs. At present, Ethereum shows early signs of bullish intent, but the market lacks conviction.
This setup reflects a broader pattern of hesitation across the crypto market. Ethereum recently printed a bullish flag pattern on its price chart, and traders are watching for a breakout to confirm upside potential. Until that move occurs, the DMI suggests that trend strength remains weak and direction is still uncertain.
Ethereum Faces Resistance as Ichimoku Cloud Signals Bearish Shift
Meanwhile, Ethereum trades at $2,246 while showing early signs of weakness on the weekly Ichimoku chart. The price has slipped below the cloud, indicating a shift in sentiment toward bearish territory. When the price moves beneath the cloud, it often suggests growing downside risk unless a strong reversal follows.
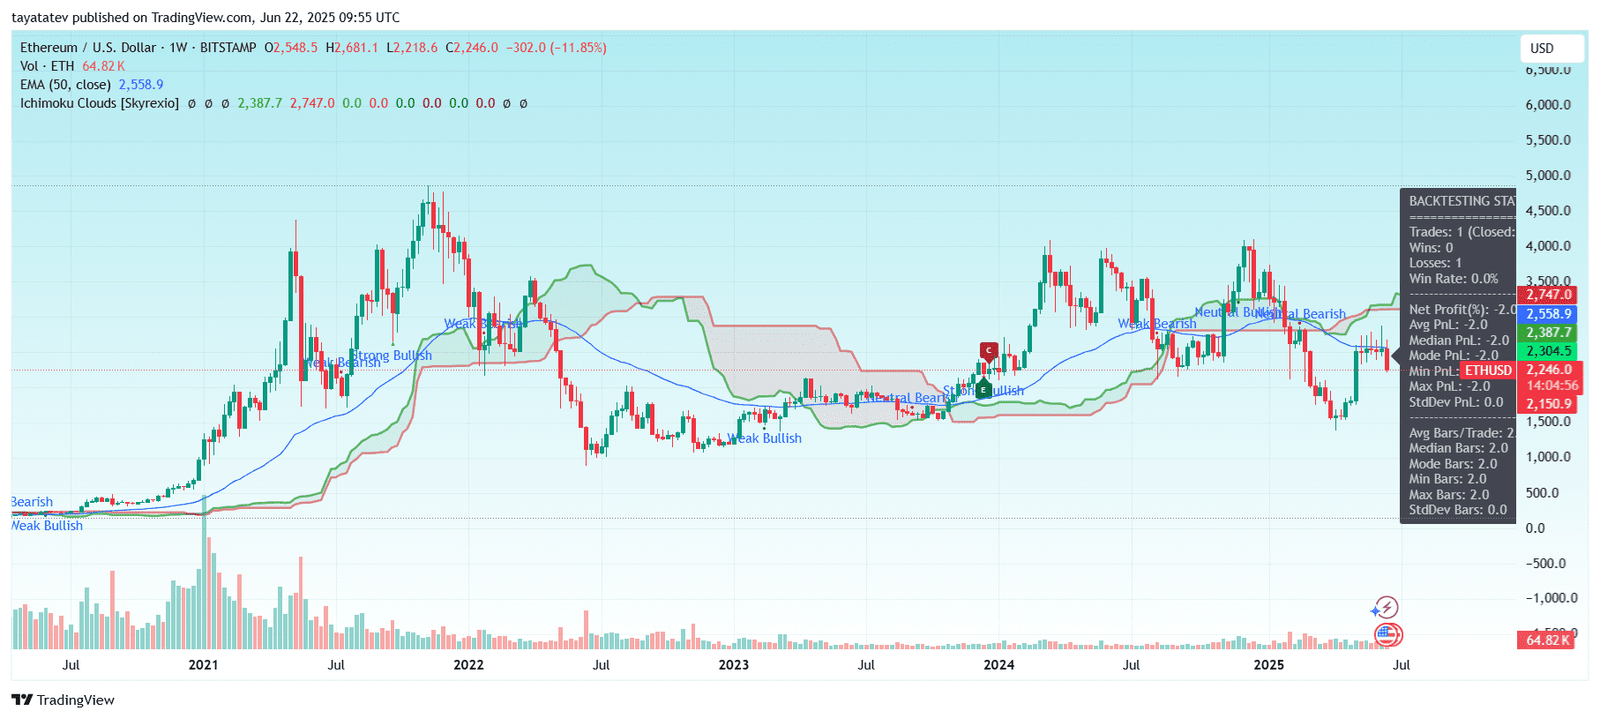
The cloud ahead remains thin and flat, signaling market indecision and lack of momentum. Thin clouds typically fail to offer solid support or resistance, making them less reliable for strong trend continuation. At the same time, Ethereum’s position under the cloud reflects broader hesitation, with the market still digesting macro pressures and geopolitical volatility.
While prior weeks flashed weak bullish signals, the most recent candle shows that Ethereum failed to reclaim the cloud, keeping bearish bias intact. The cloud’s structure does not currently suggest a strong reversal. Ethereum must break back above the cloud to flip the outlook back to bullish. Until that happens, the technical setup favors caution.
Ethereum’s 2025 Price Lags Behind Previous Years, Down 33% YTD
As of late June 2025, Ethereum’s year-to-date performance has fallen significantly behind its past two years. The chart compares ETH’s cumulative returns across 2023, 2024, and 2025. It shows that while Ethereum gained 90.08% in 2023 and 41.61% in 2024, it has dropped by 33.11% so far in 2025.
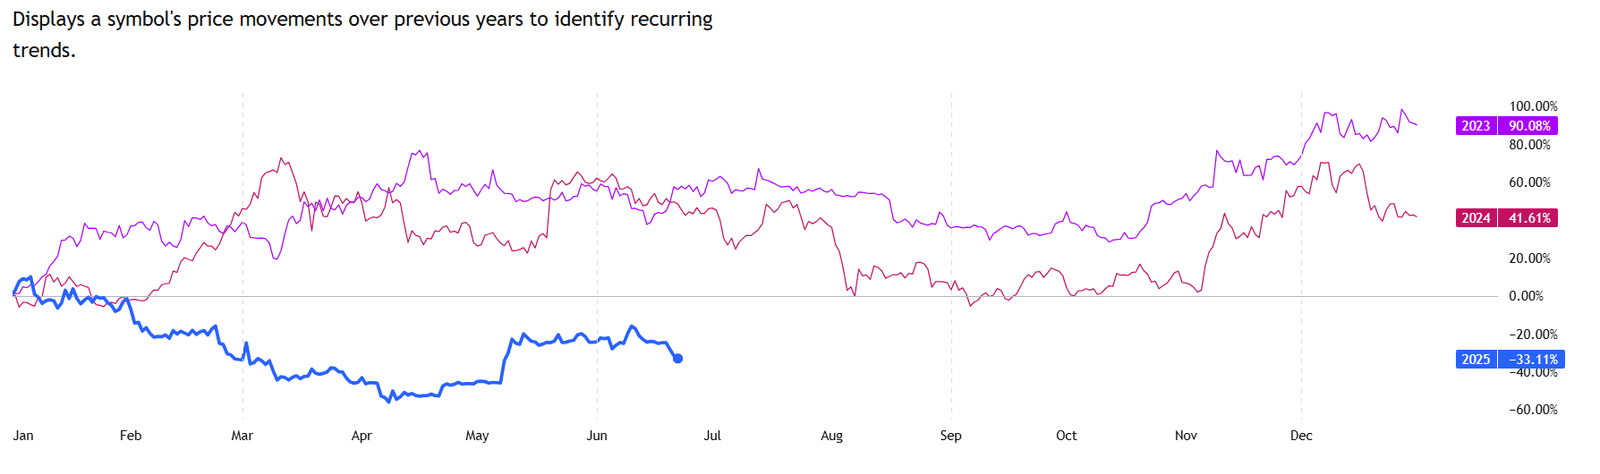
The divergence started early in the year. In January, all three lines moved closely. But by March, 2025’s blue line broke away and trended lower, while 2023 and 2024 maintained an upward slope. Throughout the spring and into early summer, the gap widened. Ethereum continued to underperform in 2025, failing to mirror the historical recovery patterns seen in previous years.
This contrast highlights a clear shift in sentiment. While past cycles recovered midyear, 2025 has yet to show that seasonal strength. The ongoing weakness in Ethereum’s current trend reflects broader uncertainty, setting this year apart from the bullish trajectories of the previous two.
Ethereum Funding Rate Turns Negative as Price Drops Below $2,300
As of June 22, 2025, Ethereum’s open interest (OI)-weighted funding rate has turned negative, reflecting a rise in short positioning. The chart shows the funding rate slipping below zero just as ETH’s price fell below the $2,300 mark.
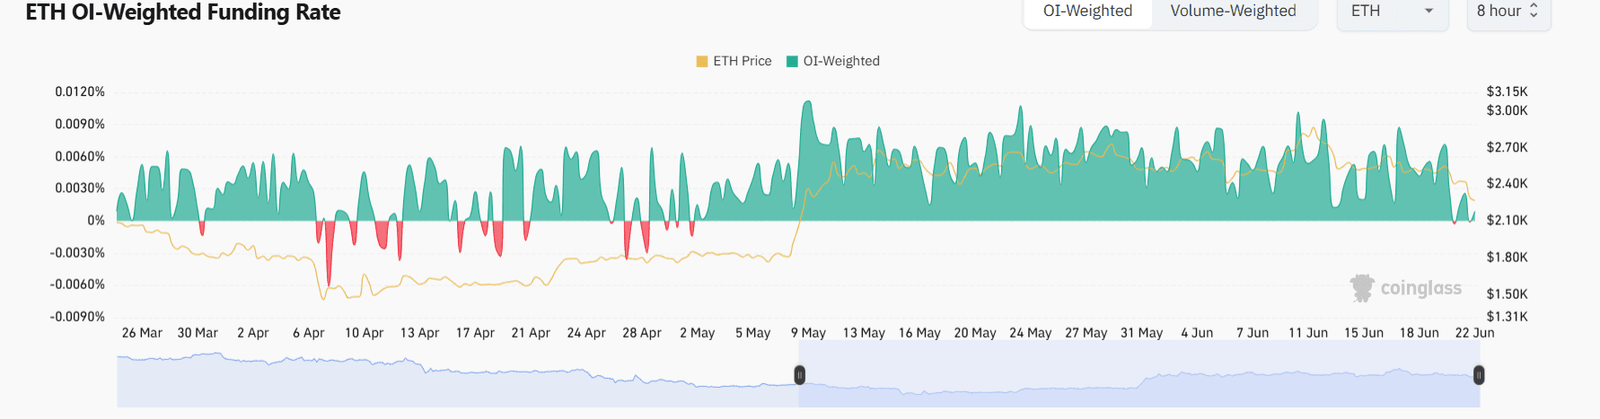
Over the past month, the funding rate mostly stayed positive, signaling dominance by long positions. However, that shifted in mid-June as price pressure increased. The rate remained volatile but leaned downward, and the most recent readings confirm that short sellers now dominate the market.
The yellow line tracking ETH’s price shows a steady decline through mid to late June, aligning with the drop in funding. The market now leans bearish in the short term, with traders increasingly paying to hold short positions. This change suggests that sentiment has weakened, and leveraged participants expect further downside.
