
On June 25, 2025, a Dogecoin whale dump sent 155 million DOGE, worth $24.6 million, to Robinhood. This large-scale movement triggered immediate selling pressure on the market.

The transfer occurred as Dogecoin hit the top of its descending channel, with price briefly reaching an intraday high of $0.1674. After the transfer, DOGE pulled back and now trades near $0.164.
Despite the pullback, Dogecoin showed a 7% daily increase, but trading volume declined 10% from the previous day. Lower trading volume during a price rise often reflects a lack of strong buyer momentum.
DOGE Robinhood Transfer Happens as Exchange Outflows Grow
While the 155 million DOGE transfer suggests possible short-term selling, exchange data presents a contrasting pattern. According to Coinglass, more than $18.34 million worth of DOGE left centralized exchanges in the past 24 hours.
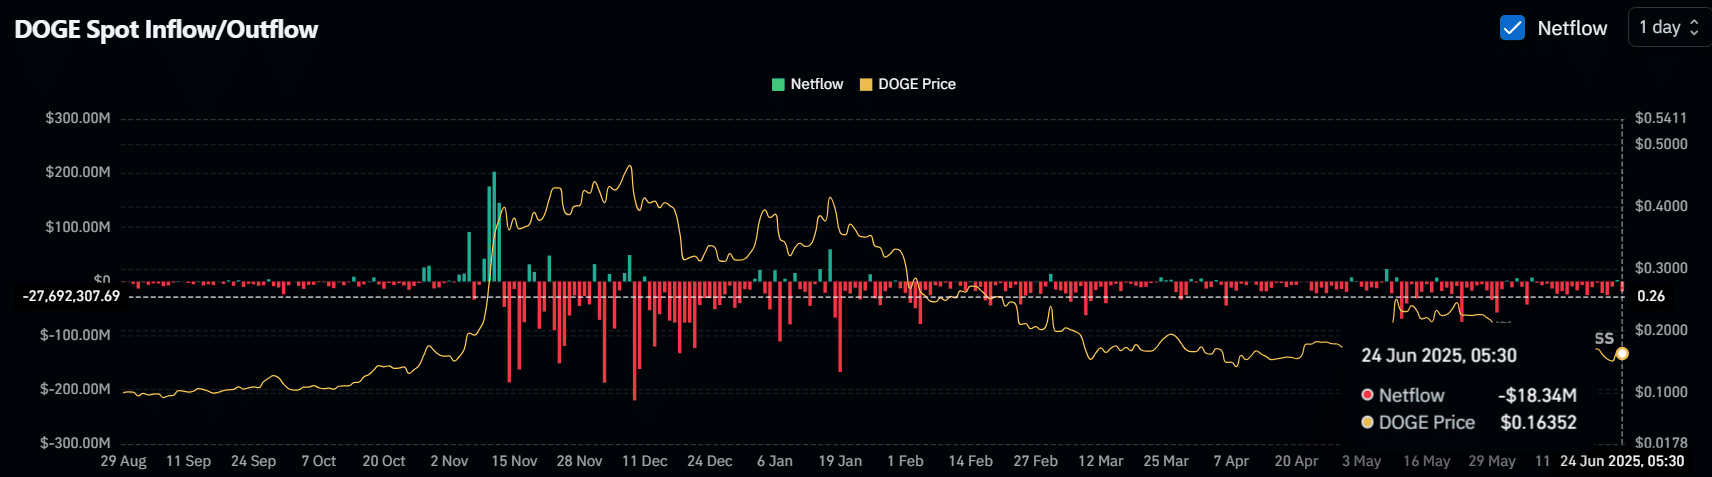
These Dogecoin exchange outflows point to accumulation by wallets that are likely not tied to exchanges. This pattern typically shows users are storing DOGE for longer periods rather than selling.
Such outflows can reduce available supply on trading platforms, even as individual whales carry out high-volume transfers like the recent DOGE Robinhood transfer.
Dogecoin August Cycle Pattern Based on Historical Timing
Crypto analyst Javier Santini shared historical data showing how Dogecoin follows a repeating cycle of peaks and bottoms. The analysis covers several years of weekly chart data.
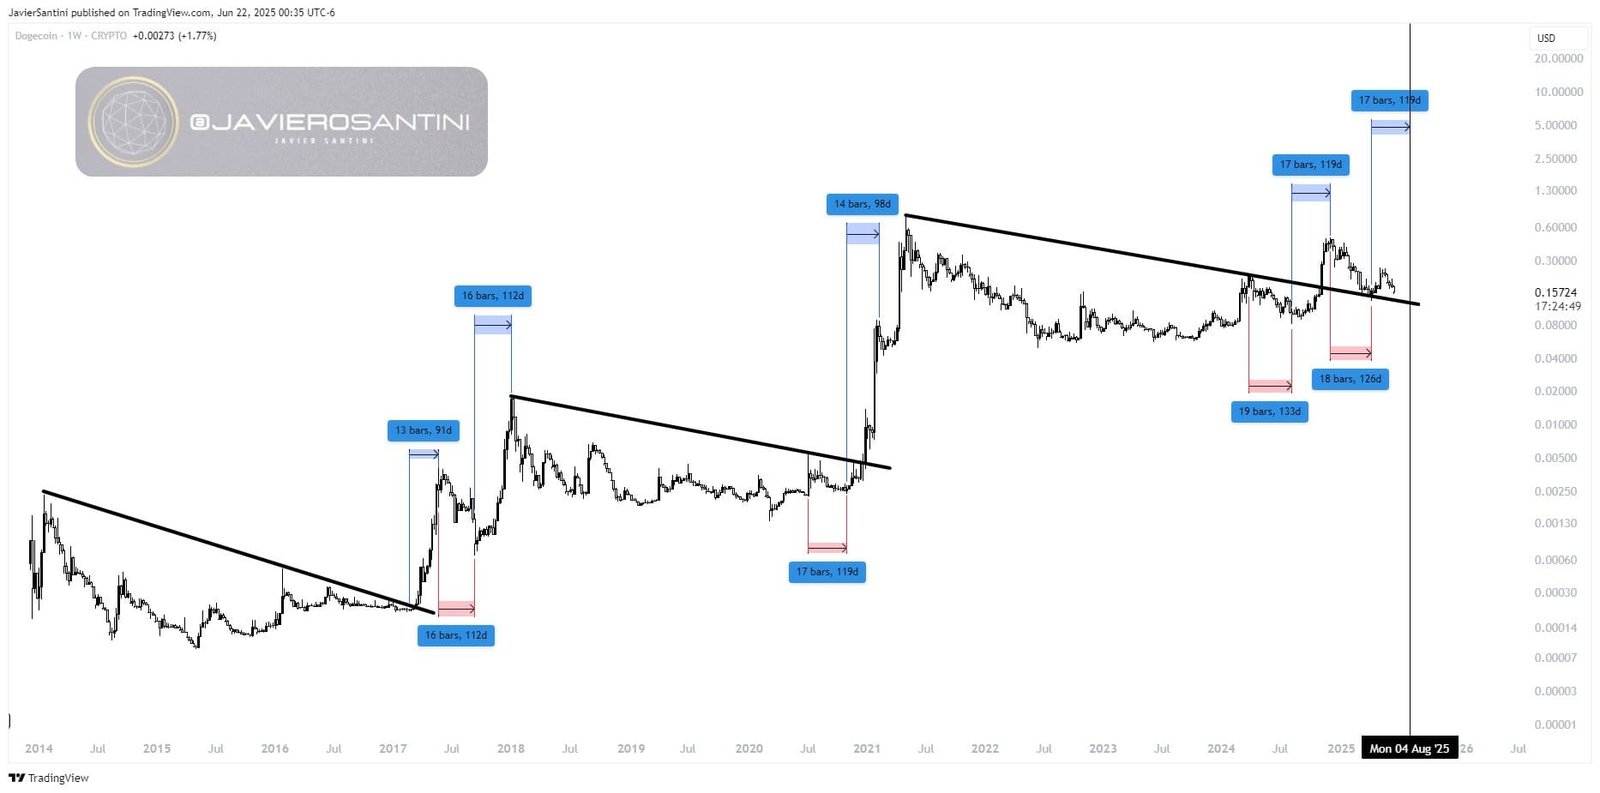
Based on past performance, DOGE cycle tops have occurred every 91 to 119 days, with an average of 107 days between peaks. Meanwhile, cycle bottoms typically take longer to form, developing over 112 to 133 days, with an average of 122 days.
The chart also shows consistent breakout points from descending trendlines followed by rapid moves to local highs. Each breakout appears to follow a bottom formation and leads into a new cycle. In total, five full cycles are mapped, including the current one.
Maximum Duration Points to August 4 Peak
Santini noted that the longest observed time to reach a cycle top was 119 days. Using this figure as the current model, he marked August 4, 2025, as the potential date when the current upward cycle could complete.
From the latest local bottom in April 2025, the current count aligns with this historical model. That low occurred near the $0.14 level, which DOGE has respected for more than two months.
Santini stated in the original post:
“$DOGE has been historically printed a bottoms of 112 to 133 days, an average of 122 days. A tops of 91 to 119 days, an average of 107 days. However I took the max duration resulting a top at 04 August.”
Next Reversal Window Falls Between Mid-July and Early August
According to the data, reversal zones often start forming between 14 to 49 days before the top. That window begins around the first week of July.
From today’s position in the current cycle, the reversal window opens next week and could last into early August. The pattern has held consistent across multiple market conditions dating back to 2017, suggesting structural behavior in Dogecoin’s historical movement.
Dogecoin August cycle timing remains in line with past phases, but price action still trades below key resistance levels. Any new top would need confirmation on volume and breakouts, which have not occurred yet.
DOGE 14-Day RSI Analysis – June 25, 2025
The 14-day Relative Strength Index (RSI) for Dogecoin shows a current value of 52.44, while the RSI moving average is 58.00. These values place DOGE in the neutral zone, with no immediate sign of overbought or oversold conditions.
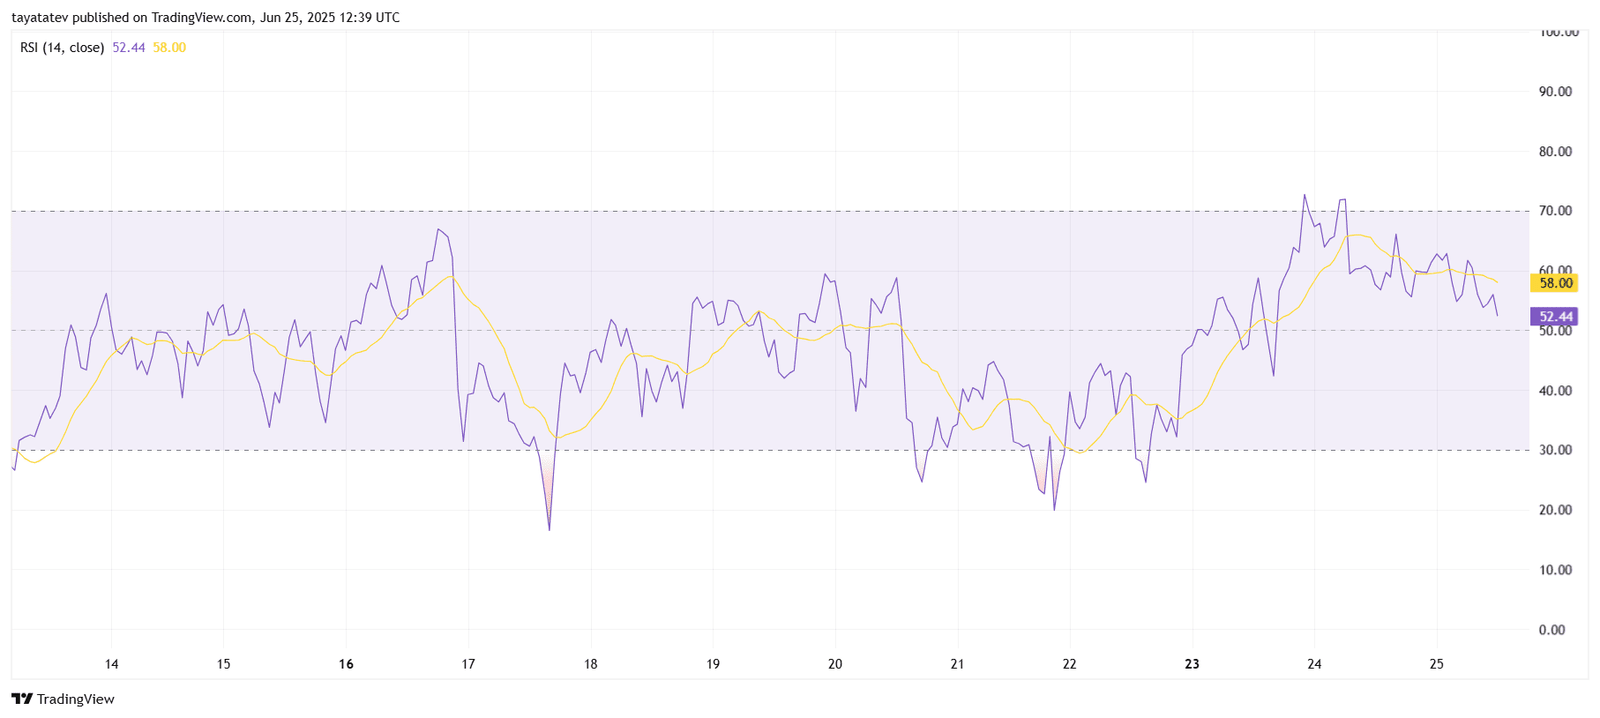
The RSI indicator moves between 0 and 100. Levels above 70 are considered overbought, and below 30 are oversold. A value around 50 signals balance between buying and selling momentum. As of now, DOGE is neither strongly trending up nor down based on RSI alone.
Recent Weakening Momentum
From June 23 to June 25, the RSItrended lower from above 60 to below the 55 level. This shows a decline in short-term momentum. The RSI dropped below its moving average line, which can often reflect bearish short-term sentiment.
Multiple small peaks and valleys appeared throughout the 10-day chart, suggesting that buying and selling pressure alternated rapidly. These fluctuations point to indecision among traders.
RSI Rejection Below 70 and Failed Support Above 60
DOGE failed to break past the 70 RSI threshold, which would have suggested strong upward momentum. Instead, the RSI reversed before reaching the overbought zone. This rejection, followed by a consistent downward slope, confirms weakening momentum in the short term.
In addition, support near the 60 RSI level did not hold, and RSI fell quickly to the current level near 52. This breakdown signals a potential pause or reversal unless new buying activity appears.
DOGE DMI Analysis – June 25, 2025
The Directional Movement Index (DMI) measures the strength of a trend using three lines:
+DI (blue): 19.87
–DI (orange): 16.82
ADX (red): 20.63
At present, the +DI is above the –DI, suggesting that upward momentum still leads. However, both lines are close together, which shows a lack of clear direction.
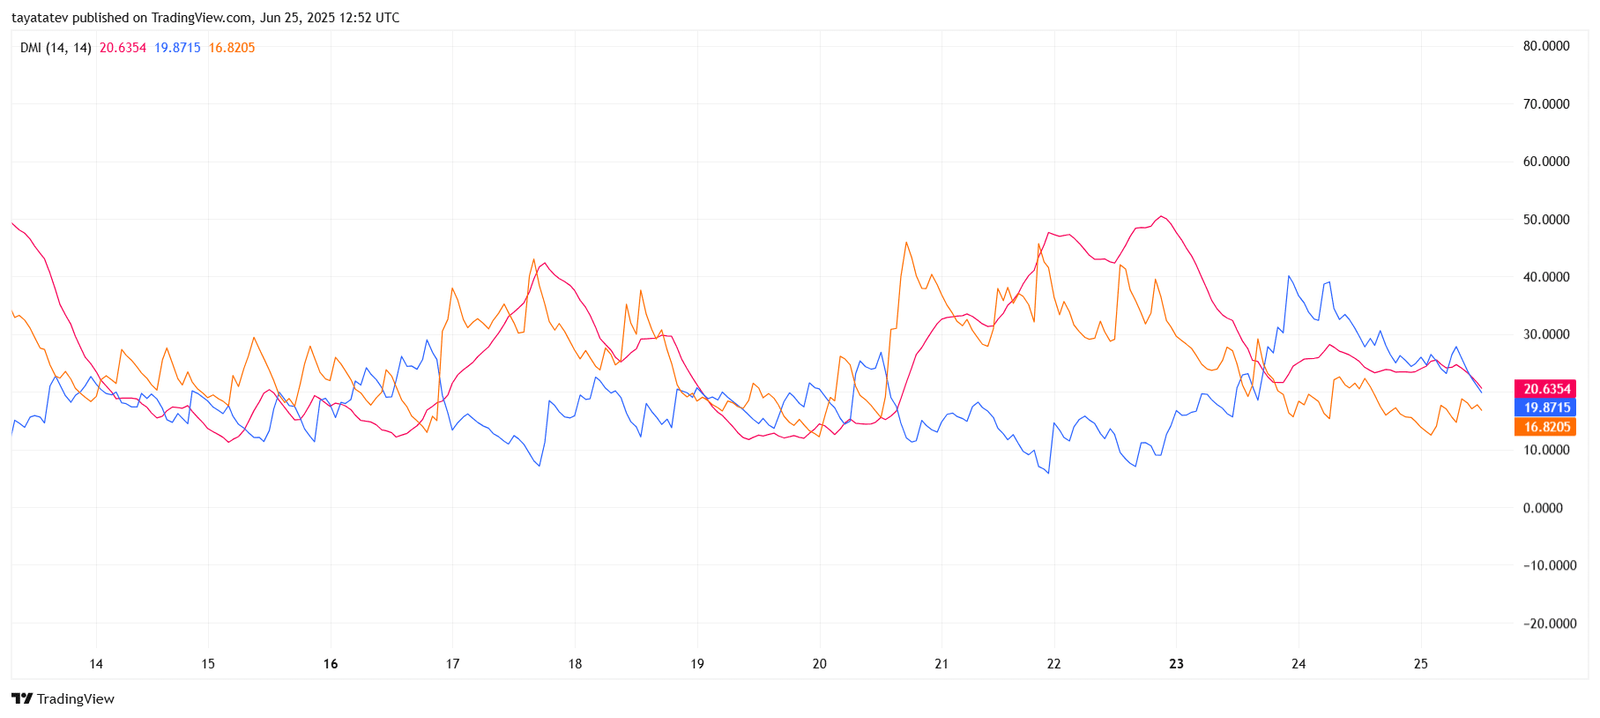
The ADX, which tracks the strength of a trend regardless of direction, is just above 20. This level indicates a weak or fading trend. When ADX stays below 25, it often reflects low volatility or consolidation.
Momentum Shift After June 23
From June 21 to June 23, ADX spiked as the blue +DI line separated from the orange –DI. That period marked the most recent bullish strength. However, ADX has since dropped from near 50 to 20.63, showing that the trend has lost force.
During the same period, +DI also declined and now sits close to –DI, reducing bullish dominance. Meanwhile, –DI has remained flat or slightly down, showing bears have not gained control but are still present.
Current Setup Signals Sideways Action
Thecurrent chart structure shows low conviction from both buyers and sellers. The ADX decline supports the idea that DOGE may remain in a range unless one side regains strength.
The drop in ADX, combined with narrowing distance between +DI and –DI, confirms that trend strength is weakening. If ADX falls below 20, the DMI would indicate no trend in effect.
