
On June 26, 2025, XRP formed a falling wedge pattern on the daily chart against the U.S. dollar. A falling wedge is a bullish reversal setup that appears when price moves between two downward-sloping and converging red trendlines. This pattern usually shows weakening selling pressure and often leads to a breakout in the upward direction.
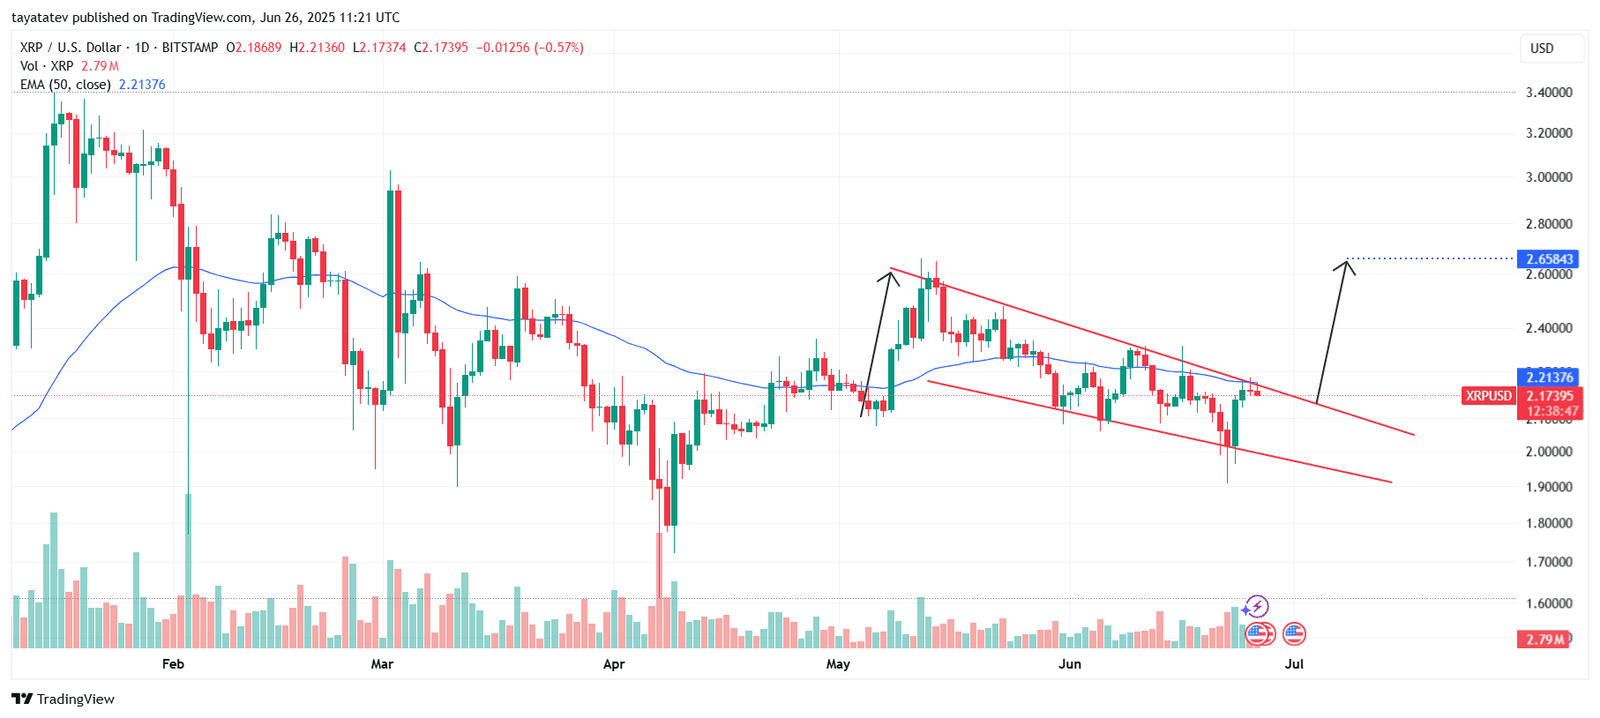
At the time of analysis, XRP trades at $2.1739, slightly below the 50-day Exponential Moving Average (EMA), which sits at $2.2137. The pattern began forming in May after a sharp price surge and has continued into late June, with lower highs and lower lows compressing toward a breakout point.
If XRP breaks out of the wedge with strong volume and closes above the 50 EMA, the pattern may confirm. In that case, the projected upside target is around $2.6584, which would be a 22% increase from the current price.
So far, the price has attempted to test the upper red trendline but has not yet closed above it. A confirmed breakout above both the wedge and the 50 EMA would signal renewed bullish momentum. The volume, currently at 2.79 million, remains a key factor to watch during the breakout attempt.
XRP SMI Indicator Turns Bullish on June 26, 2025
The Stochastic Momentum Index (SMI) for XRP showed a bullish crossover. The blue SMI line moved above the orange signal line, rising to 19.82 while the signal line reached 5.55. This shift occurred after both lines had recently bottomed out below the −40 level, an area often seen as oversold.
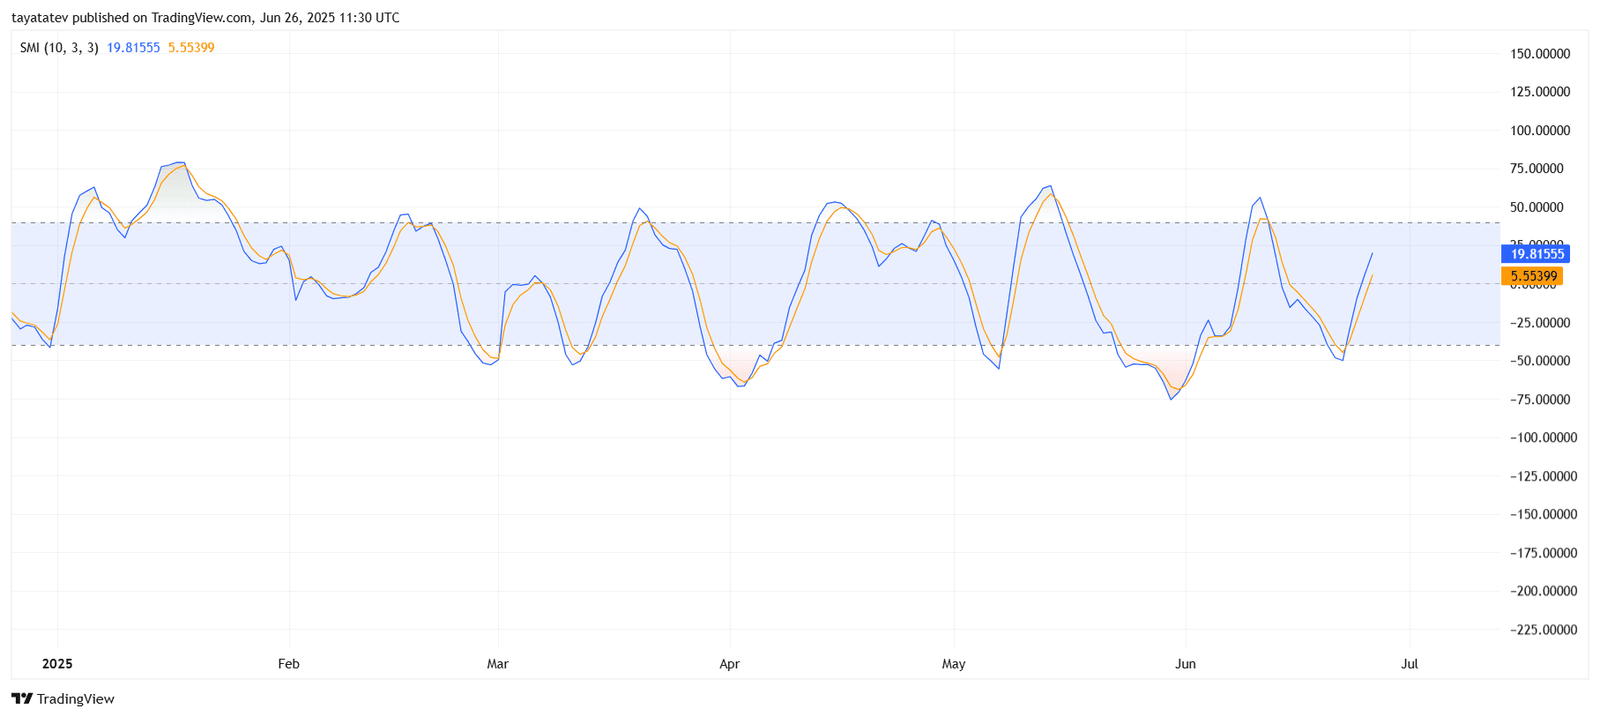
The SMI is a momentum oscillator that measures how far price is from its median over a set period. A bullish crossover near the lower boundary, followed by upward movement, usually signals early upside momentum. In this case, the indicator suggests that buying pressure is returning after a recent downtrend.
The upward slope of both lines supports the possibility of continued price recovery. If this momentum holds, it could reinforce the bullish setup already visible on the falling wedge pattern in the price chart.
XRP RSI Shows Early Signs of Recovery on June 26, 2025
Meanwhile, the Relative Strength Index (RSI) for XRP climbed to 48.95, slightly above its 14-day moving average at 44.73. The RSI had recently bounced from a lower reading near 35, signaling that selling pressure may have eased.
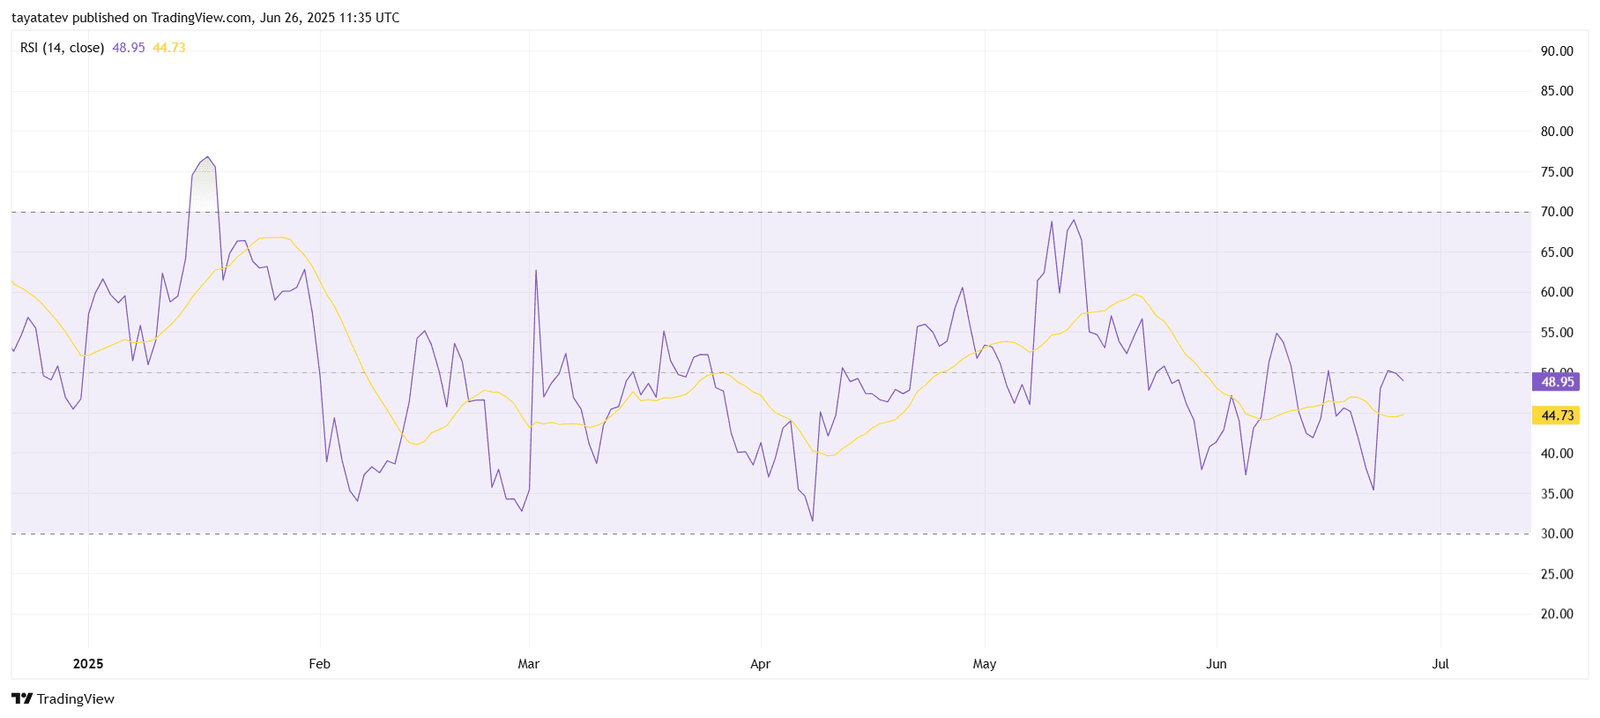
The RSI measures the strength of recent price moves on a scale from 0 to 100. Values below 30 suggest oversold conditions, while readings above 70 indicate overbought territory. When RSI moves upward from a lower region and crosses its moving average, it often signals improving bullish momentum.
Although the RSI remains under the midpoint of 50, the upward direction suggests that buyers are beginning to gain strength. This shift aligns with other bullish signals seen in XRP’s chart patterns and momentum indicators.
XRP Seasonal Trends Show Weak 2025 Performance Compared to Previous Years
The seasonal chart compares XRP’s price behavior across 2023, 2024, and 2025 to identify recurring trends. As of June 26, 2025, XRP shows a negative year-to-date return of −6.52%, marked in blue. This contrasts sharply with the same periods in earlier years.
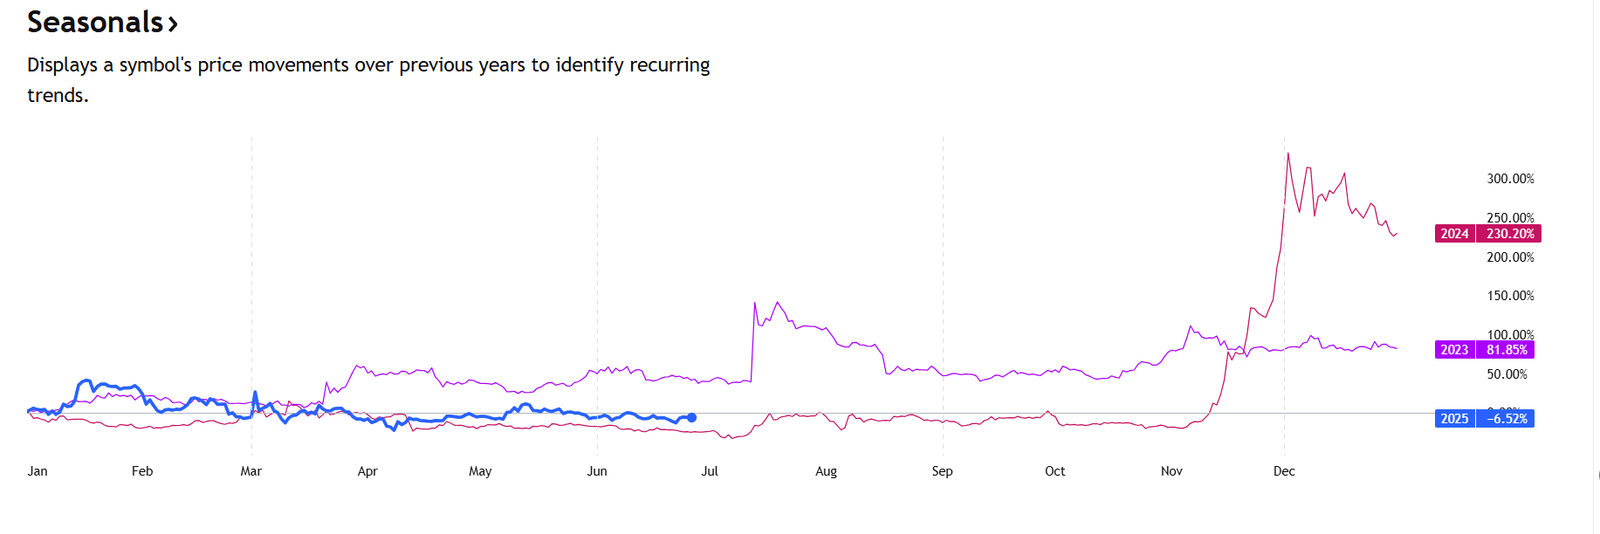
In 2023, XRP delivered an 81.85% gain by year-end, with a noticeable spike starting in July and rising steadily through the last quarter. In 2024, performance was even stronger. XRP surged sharply in November and December, finishing the year with a 230.2% return.
So far in 2025, the trend has reversed. The price has declined gradually since March, with no visible recovery during typically strong mid-year months like May or June. Unlike the sharp rallies in late 2023 and 2024, the 2025 curve remains below zero.
If XRP repeats its late-year behavior, a potential seasonal reversal could emerge in Q4. However, at this point in the year, the 2025 trend lags far behind prior bullish cycles.
ExoraPad Prepares XRP Ledger Testnet Launch for Q3 2025
On June 26, 2025, ExoraPad announced plans to launch the testnet version of its AI-powered launchpad on the XRP Ledger in early Q3. The move follows the release of its interactive prototype, which demonstrated staking, project onboarding, AI vetting, and governance features to the community.
The prototype received positive feedback and allowed the development team to improve the platform’s design and user interface. Now, ExoraPad is entering the next phase by deploying a live testnet version. This testnet will run on the XRP Ledger and allow users to simulate project launches, test staking functions, and participate in mock governance voting in a risk-free environment.
The company said the testnet will help assess platform performance under real conditions, check smart contract security, and gather user feedback. These steps will support a smoother mainnet launch in the coming quarters. ExoraPad aims to create a decentralized and AI-driven launchpad focused on Real World Assets (RWAs), DePIN, and Web3 projects.
By choosing the XRP Ledger, ExoraPad wants to use its fast transaction capabilities and low costs to support scalable project launches. The team also confirmed that ExoraPad will be the first AI-integrated launchpad built on XRPL.
According to the announcement, ExoraPad raised over 98,000 XRP during its presale. Its native token, $EXP, is already live and trading on the Magnetic DEX. Following the testnet rollout, the team will begin backend integrations, make final adjustments, and move closer to a full mainnet release. They also plan to share progress reports and technical updates in the coming weeks.
