Robinhood announced on X that Ethereum co-founder Vitalik Buterin, Robinhood Crypto general manager Johann Kerbrat, and A.J. Warner, chief strategy officer at Offchain Labs, will join a fireside chat on Monday, July 1. Offchain Labs is the team behind Arbitrum.

The discussion will take place during a Robinhood Europe event in Cannes, France. The company described the event as the unveiling of its “biggest crypto announcements of the year.”
Arbitrum–Robinhood Deal May Be Near
On May 8, Bloomberg reported that Robinhood was building a blockchain platform to let European users trade U.S. stocks. At the time, sources said the firm was in talks with both Arbitrum and Solana to power the network, though no decision had been finalized.
Now, speculation is rising that Robinhood selected Arbitrum.
“Looks like Robinhood chose Arbitrum,”
wrote former Ethereum core developer Eric Connor on X.
Omar Kanji, a partner at Dragonfly, also weighed in on the rumors.
“Pure speculation, but imo Ethereum + Arbitrum + RH only means one thing. Robinhood going to announce its chain tomorrow,”
he posted on Sunday.
The Robinhood crypto event in Cannes will reveal whether the partnership and blockchain launch rumors hold true.
Arbitrum Breaks Bullish Flag With Rising Volume, Eyes 73% Rally to $0.6186
On June 30, 2025, Arbitrum(ARB/USDT) broke out of a bullish flag pattern on the daily chart. A bullish flag appears when a strong upward move is followed by a downward-sloping channel. This pattern often signals price continuation after a short consolidation.
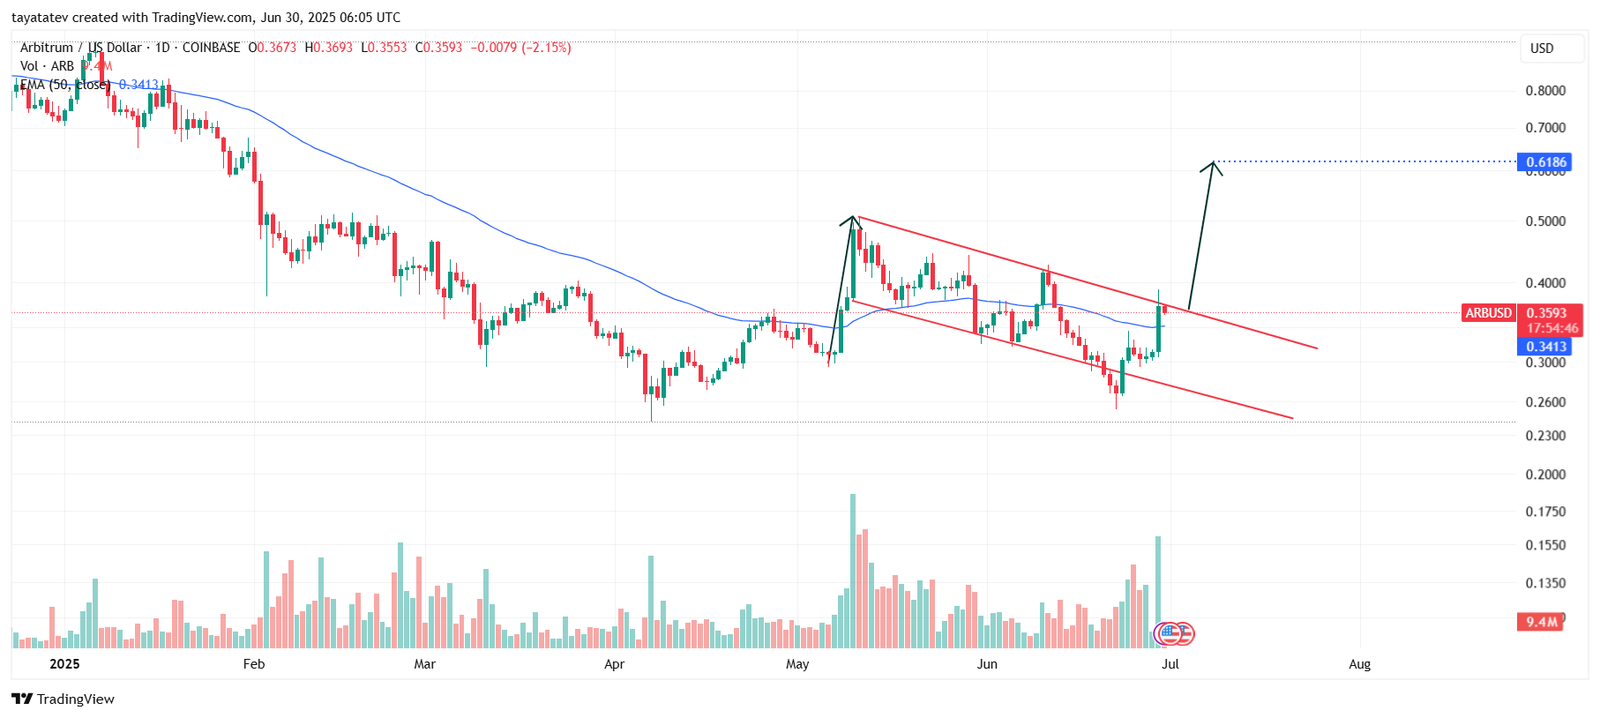
The pattern started in early May 2025 after ARB jumped sharply. It then entered a descending parallel channel, which formed the flag structure. On June 30, the price closed above the upper red trendline, confirming a breakout. That move signals a potential continuation of the earlier rally.
The chart shows the 50-day Exponential Moving Average (EMA) at $0.3413. Arbitrum broke above this key trend indicator during the breakout, turning it into short-term support. Closing above the EMA with strong volume confirms growing bullish momentum.
The breakout also came with a spike in daily volume, which reached above 9.4 million. That volume level is the highest since mid-May 2025 and supports the strength of the breakout. A rise in volume during a breakout often confirms trader conviction.
The height of the previous rally before the flag formation suggests a measured move of about 73% from the breakout level. Based on the current price of $0.3593, this points to a projected upside target near $0.6186.
The next key resistance zone is now set at that level. If momentum continues and volume remains high, Arbitrum may move toward this target in the near term.
Arbitrum DMI Chart Shows Bullish Momentum Building
The Directional Movement Index (DMI) chart for Arbitrum (ARB/USDT), captured on June 30, 2025, confirms growing bullish strength. The DMI includes three key lines:
+DI (Positive Directional Indicator) – blue line at 33.9865
–DI (Negative Directional Indicator) – red line at 15.6077
ADX (Average Directional Index) – orange line at 20.0079
The +DI crossed above the –DI earlier in late June 2025, signaling a shift in momentum toward buyers. This crossover is often one of the first signs of a trend reversal from bearish to bullish.
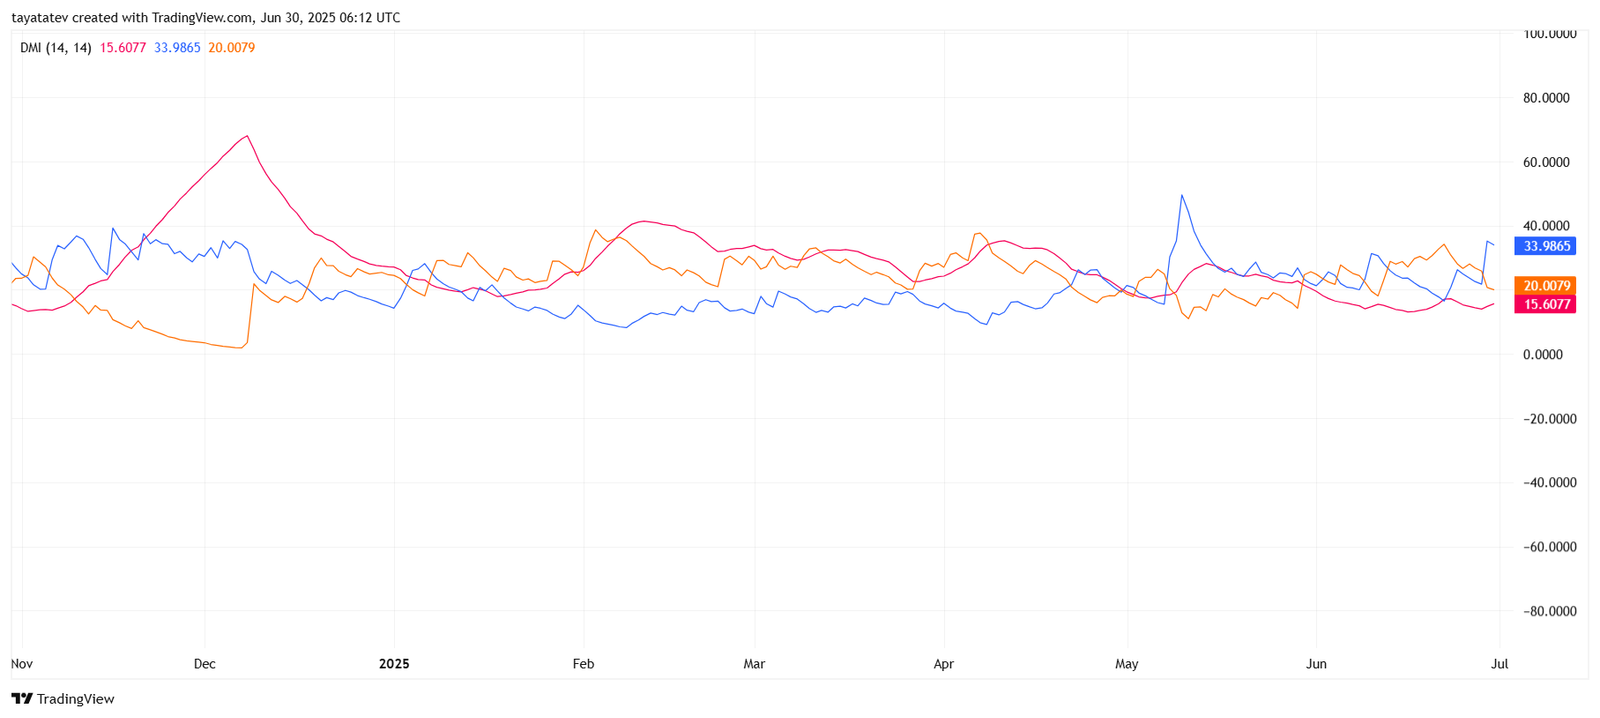
Now, the +DI has moved significantly higher than the –DI. That separation confirms increasing buying pressure. A wide gap between the two lines strengthens the bullish signal.
The ADX, currently at 20.0079, shows a mild uptrend in strength. A rising ADX above 20 confirms that a trend is starting to form. If it climbs above 25, it would validate the bullish trend.
This setup supports the recent bullish flag breakout seen on the Arbitrum price chart.
Arbitrum RSI Breaks Above Neutral Zone, Shows Strengthening Momentum
Arbitrum’s Relative Strength Index (RSI) closed at 57.43, breaking above the neutral 50 level for the first time in several weeks. RSI measures market momentum, with values above 50 signaling bullish strength and values below 50 indicating bearish pressure.
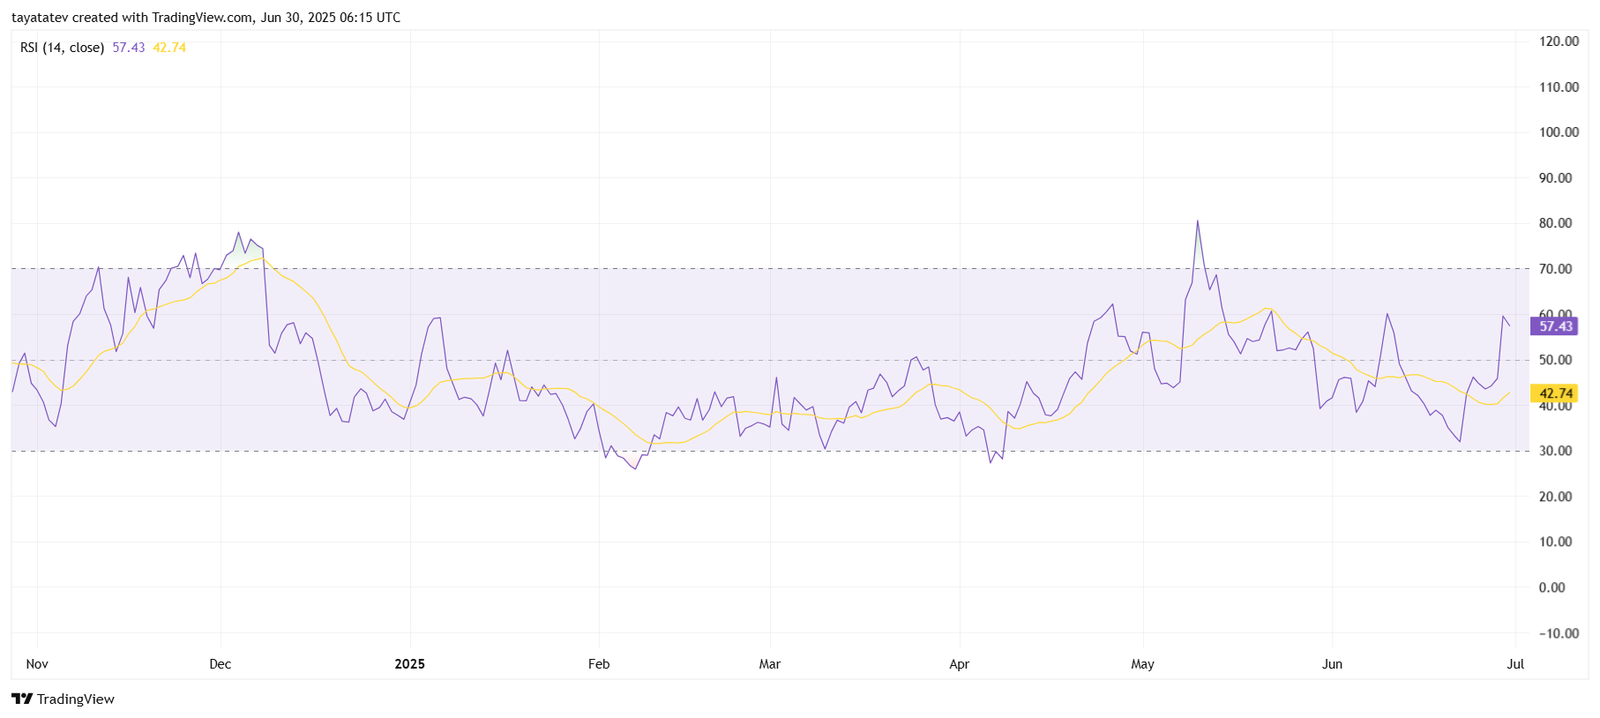
The RSI (purple line) has crossed above its own 14-period moving average (yellow line), which currently sits at 42.74. This crossover confirms upward momentum and supports the bullish breakout seen in the price chart.
The RSI’s recent rise from below 30 to above 57 also suggests a strong reversal from oversold conditions. That move indicates buyers are gaining control after weeks of sideways or declining pressure.
The RSI remains well below the overbought threshold of 70, meaning Arbitrum still has room to move higher before showing signs of overheating. This supports further potential gains if current momentum holds.
Arbitrum MACD Turns Bullish as Signal Line Crossover Confirms Momentum Shift
As of June 30, 2025, the Moving Average Convergence Divergence (MACD) indicator for Arbitrum (ARB/USDT) has turned bullish. The MACD line (blue) crossed above the signal line (orange), confirming a positive trend reversal.
The MACD line is at 0.0082, while the signal line sits lower at –0.0055. This crossover confirms upward momentum. MACD crossovers above the zero line often indicate the start of a new bullish trend.
The MACD histogram has also shifted to green, which reflects strengthening bullish momentum. The histogram bars are rising gradually, suggesting growing buying interest.
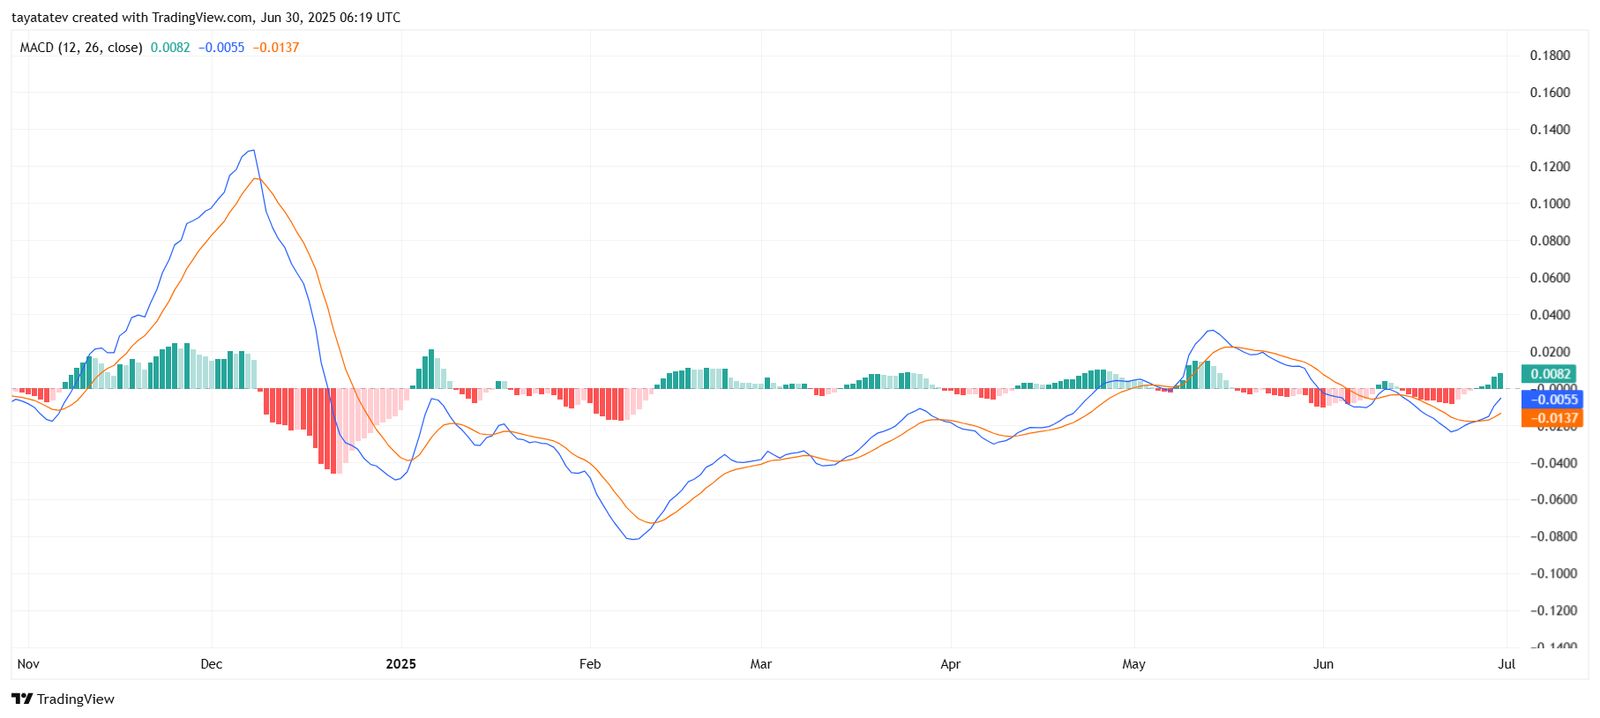
Both lines now move above the zero baseline, a zone associated with positive price action. If this trend continues, it will further support the upside target suggested by the bullish flag breakout.
