
Solana (SOL) recorded an unprecedented surge in network activity, with daily active addresses soaring to 14.63 million on July 7, 2025, according to data from Santiment. This figure marks the highest single-day total ever registered on the network.
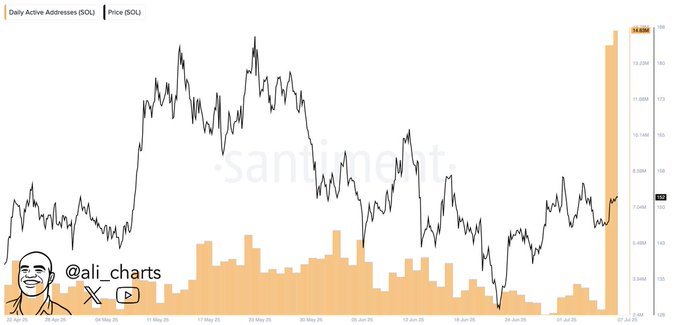
The entire chart tracks Solana’s daily active addresses (orange bars) alongside its price (black line) from late April to early July. For most of this period, activity fluctuated between 2 million and 6 million addresses per day. However, July 7 showed an extreme spike, with active addresses more than doubling the previous highs.
Throughout May, Solana’s price rallied, peaking near the end of the month. During this time, network activity steadily increased, suggesting a healthy correlation between user growth and price momentum. After the price peaked, both metrics declined. However, while the price continued trending downwards through June, activity remained relatively stable until early July.
Starting July 4, active addresses began climbing sharply. Within just three days, the number surged from below 2 million to over 14 million. This sharp rise in address count was not accompanied by a similar price increase, which stayed below $150 during the same period.
This divergence suggests that onchain activity—possibly driven by bots, airdrop farming, or new user onboarding—has increased independent of market speculation. While the price of SOL has yet to respond, the spike in addresses could indicate heightened protocol usage or growing retail interest.
No major announcements have been linked to the activity spike yet. However, the data shows clear acceleration in network usage at a time when broader crypto markets remain mostly flat.
Solana Breaks Out of Bullish Flag Pattern, Eyes 55% Rally Toward $231
On July 8, 2025, Solana SOL/USDT formed a bullish flag pattern on the daily chart, signaling a potential upward continuation. A bullish flag pattern appears after a strong price move, followed by a downward-sloping consolidation. It usually suggests that the market may continue in the direction of the original rally once the price breaks above the flag’s resistance.
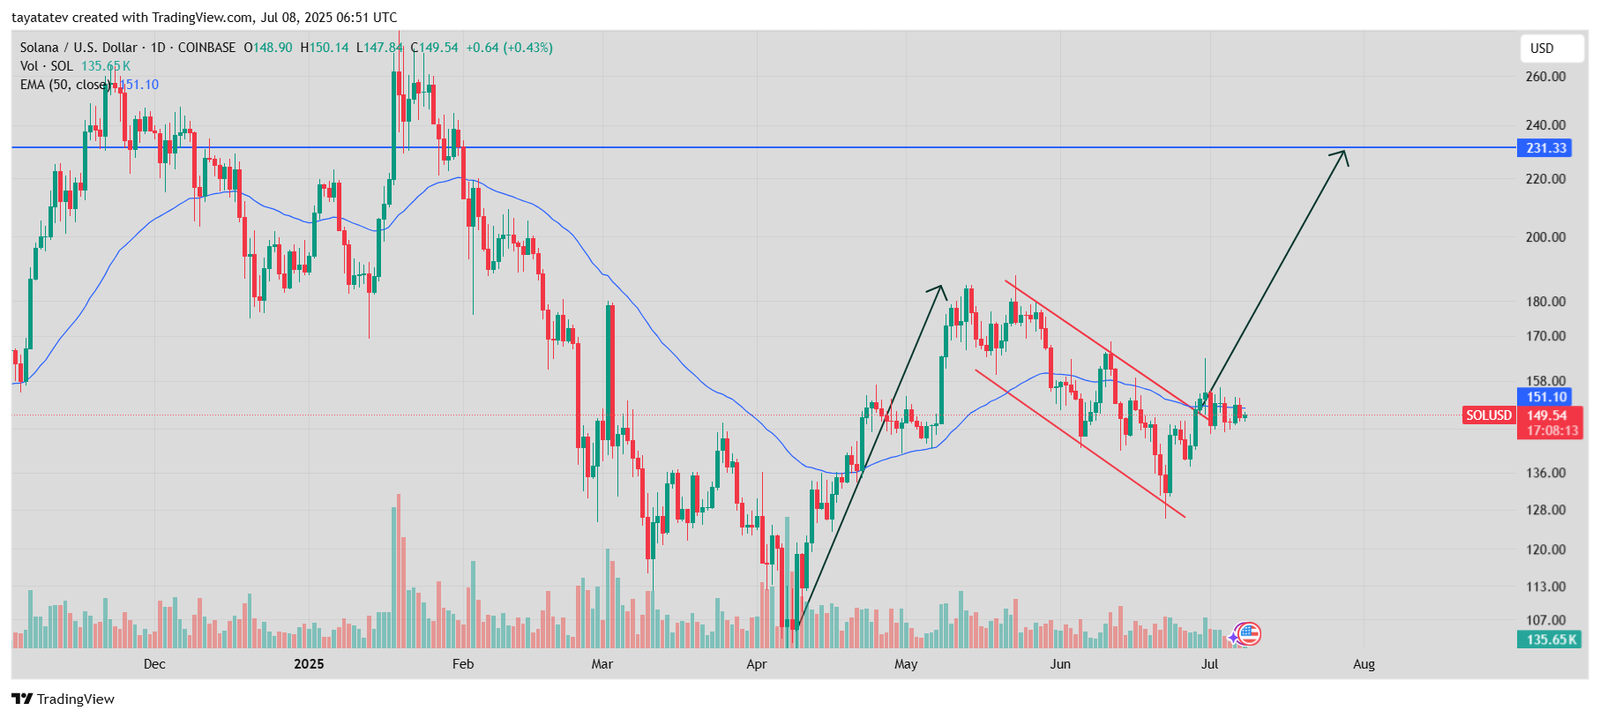
Currently, Solana trades around $149 and has already broken out of the flag formation. This breakout confirms the pattern and implies a possible 55% rally from the breakout point, which targets a price near $231.33. The breakout area aligns with the current price zone, meaning SOL is already retesting the flag structure, a common technical move before further gains.
Earlier in April, Solana surged from below $110 to over $170, creating the initial flagpole. In May and June, the price entered a downward channel, forming the flag itself. After weeks of consolidation, SOL broke above the upper trendline in early July and now hovers just below the 50-day Exponential Moving Average (EMA), which stands at $151.10.
If Solana holds above this EMA and the breakout zone, the bullish continuation could gain momentum. The volume has also picked up around the breakout, supporting the potential strength behind the move.
While the broader crypto market remains mixed, Solana’s strong onchain activity—highlighted by the recent record 14.63 million active addresses—adds further context to the bullish setup. This combination of technical and network signals points to a growing possibility of upside if momentum sustains in the coming days.
Solana DMI Signals Growing Bullish Momentum as Buyers Regain Control
On July 8, 2025, the Directional Movement Index (DMI) for Solana (SOL) showed a potential shift in market control as buying pressure increased. The DMI uses three lines: the +DI (blue), –DI (red), and the Average Directional Index (ADX, orange). It helps gauge the strength and direction of a trend.
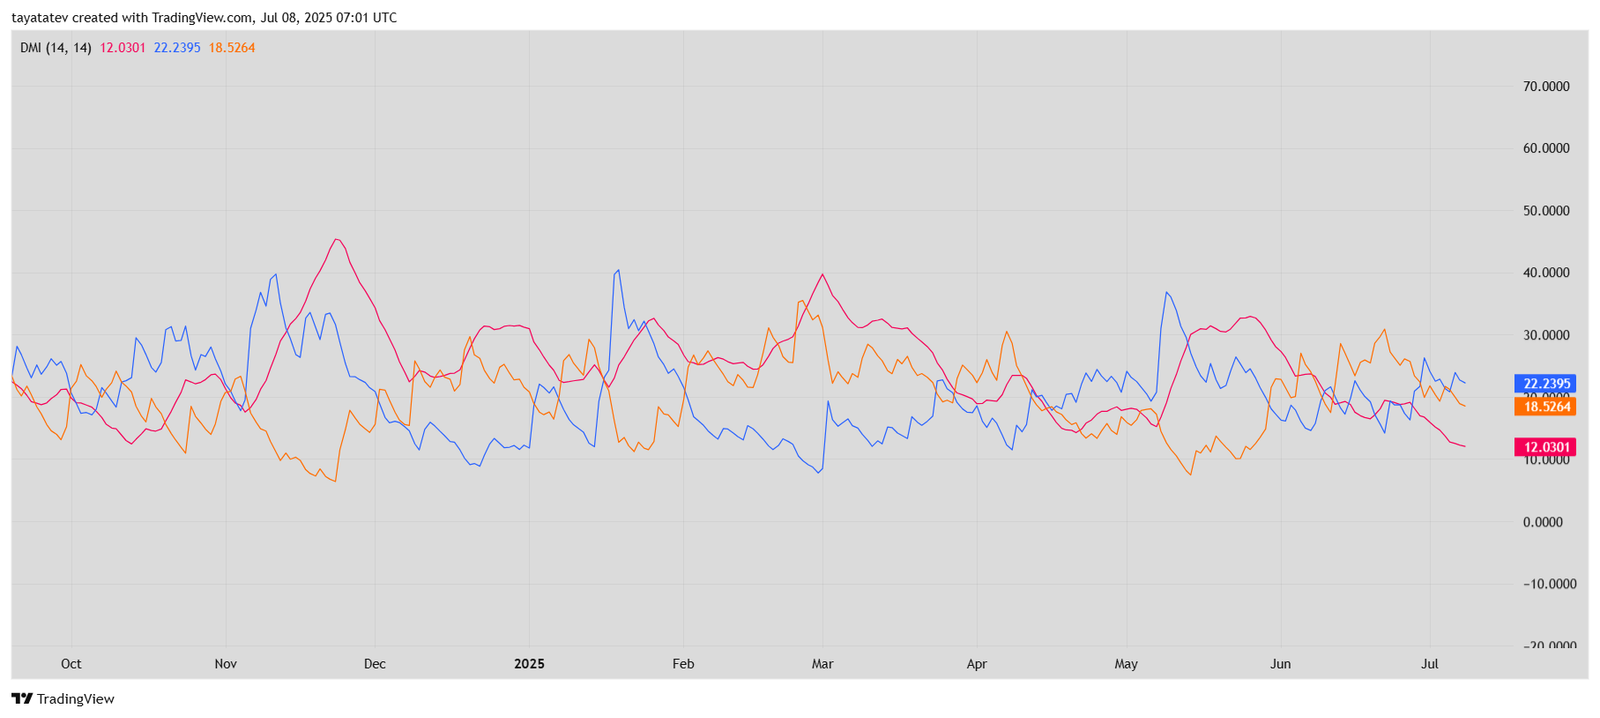
As of today, the +DI stands at 22.24 while the –DI dropped to 12.03. This crossover confirms that bulls are taking over. When the +DI crosses above the –DI and the gap widens, it typically indicates that upward momentum is building.
Meanwhile, the ADX is at 18.53. This line measures the strength of the trend but not its direction. A rising ADX line above 20 would strengthen the signal that the current trend is gaining force. Although the ADX is still slightly below that level, it has started turning upward, showing signs of acceleration.
Looking back over the past nine months, the chart shows that bullish crossovers between the DI lines often preceded upward moves. For example, similar setups in late April and mid-May resulted in short-term rallies. The current positioning closely mirrors those past patterns.
The latest DMI reading aligns with the breakout seen on the daily chart, where Solana formed and exited a bullish flag. This adds more weight to the technical outlook that SOL could be entering a sustained upward phase. The rising +DI and falling –DI confirm increasing buying power and weakening selling interest.
If the ADX continues rising in the next few sessions, it will confirm the strength behind this trend shift, opening the way for further price appreciation.
Solana RSI Nears Neutral Zone as Momentum Begins to Shift
On July 8, 2025, Solana’s 14-day Relative Strength Index (RSI) stood at 49.60, hovering just below the neutral 50 level. The RSI tracks price momentum and ranges from 0 to 100. Values above 70 suggest overbought conditions, while readings under 30 point to oversold territory.
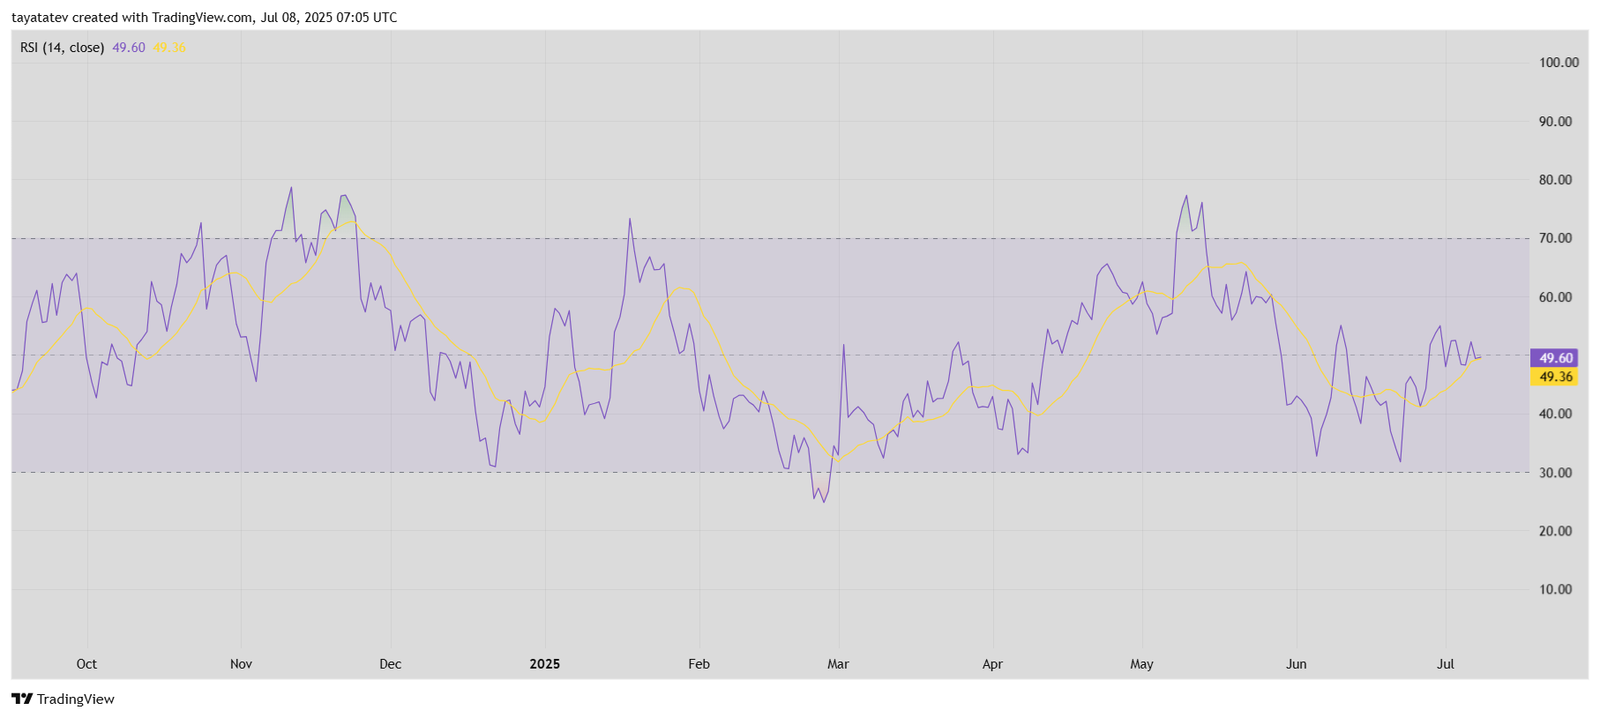
Currently, the RSI is rising gradually, following a bounce from the mid-30s in June. The RSI line (purple) has also crossed above its yellow moving average, indicating early signs of strengthening momentum. While not yet in bullish territory, this crossover can often signal a shift toward positive price movement.
For most of the past three months, the RSI remained below 50, reflecting a weak or indecisive trend. However, the recent pattern shows improving sentiment, especially after Solana broke out of its bullish flag on the price chart. This shift in RSI aligns with growing onchain activity and renewed buyer interest seen in other indicators.
If RSI pushes decisively above 50 and continues to rise, it could confirm that bulls are regaining control of short-term momentum. So far, the indicator remains neutral, but its upward slope points to a potential trend change.
