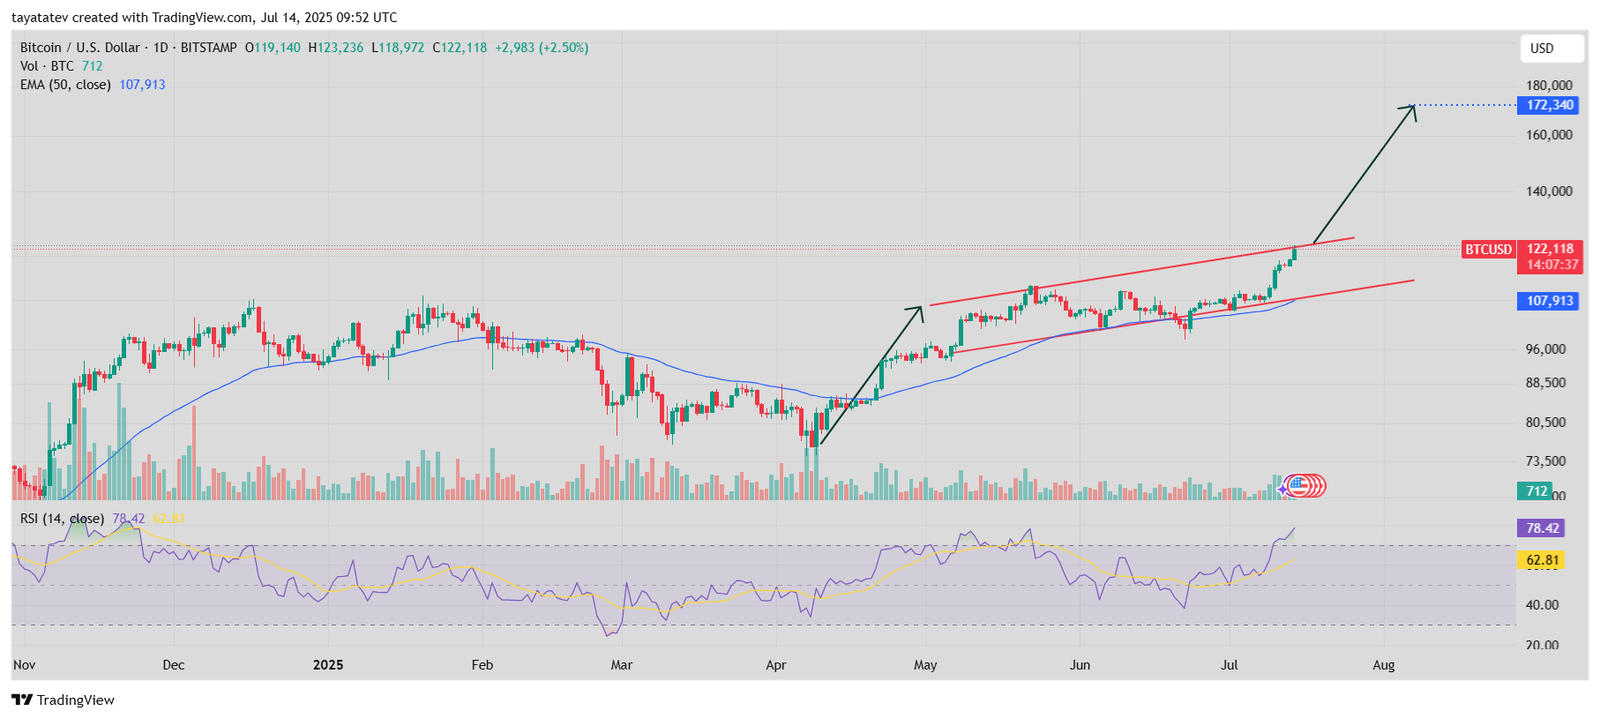
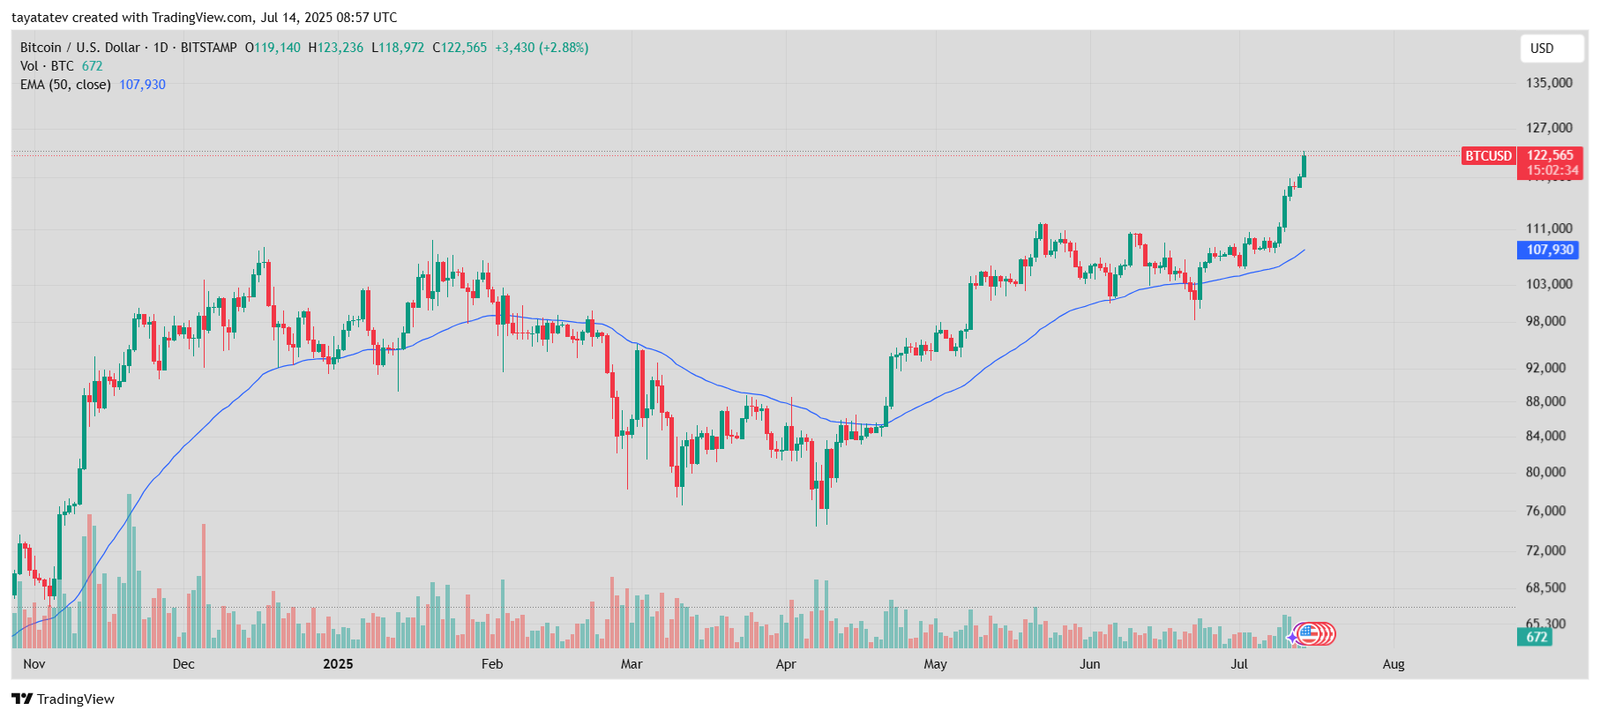
Bitcoin set a new all-time high on July 14, 2025, climbing to $122,565 by mid-session. The daily chart shows a 2.88% increase from the previous close. Price opened at $119,140 and reached an intraday peak of $123,236 before stabilizing. Volume reached 672 BTC on Bitstamp, confirming strong trading activity.
This move continued a broader rally that started in late June, when Bitcoin traded near $107,000. The 50-day Exponential Moving Average, now at $107,930, remains far below current levels, showing strong bullish separation. Since late June, Bitcoin has gained more than 14%, with higher momentum over the past three sessions.
The rally coincides with major institutional inflows and rising speculation ahead of “Crypto Week” in the United States, where lawmakers are set to review multiple digital asset bills. ETF inflows, increased treasury exposure from corporations, and growing demand among wealth managers have added further upside pressure.
Gert van Lagen: Cup & Handle Target Reached, Next Stops Higher
Technical analyst Gert van Lagen posted a long-term chart on X, marking Bitcoin’s breakout toward $120,000 as a completed Cup & Handle formation. He confirmed that Bitcoin reached the linear target for the pattern, which started forming in 2022. He wrote that the $120K level matches the breakout measurement from the handle’s low to the neckline.
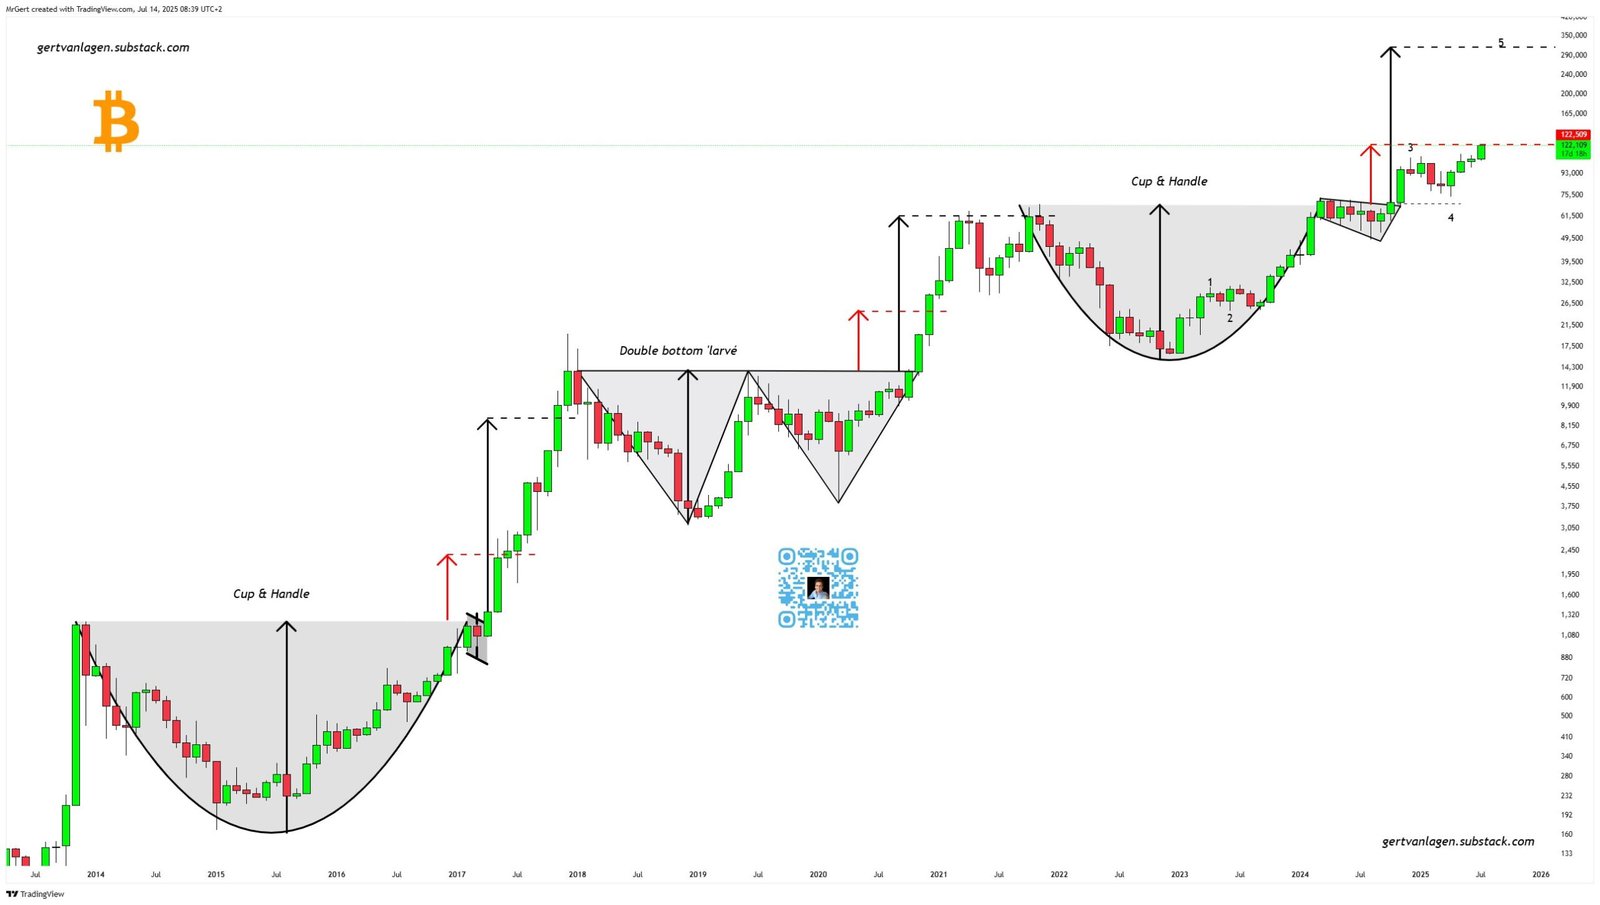
His chart included historical cycles dating back to 2013. He showed how Bitcoin formed a similar Cup & Handle from 2014 to 2017, followed by a double bottom structure between 2018 and 2020. The current formation started in the 2022 correction and took nearly two years to complete.
Van Lagen noted that if history follows the same path, the next potential level sits at the exponential target based on the logarithmic chart structure. That level is now above $310,000. He emphasized that previous bull cycles also saw linear breakouts met first, followed by larger moves driven by long-term buying pressure and market expansion.
The exponential target appears on the same chart section as previous market tops, using a repeatable structure that has held across three macro phases. Van Lagen’s commentary has circulated widely across trading communities, especially as Bitcoin continues to trade near session highs.
Jelle Maps 7-Year Channel as Bitcoin Approaches Breakout Zone
On July 14, crypto analyst Jelle (@CryptoJelleNL) shared a long-term Bitcoin chart, highlighting a rising parallel channel that has contained price movements for more than seven years. The tweet read:
“#Bitcoin has spent the past 7+ years inside this rising channel — and it’s trying to break into the upper half again A lot of uncharted territory ahead to explore ”
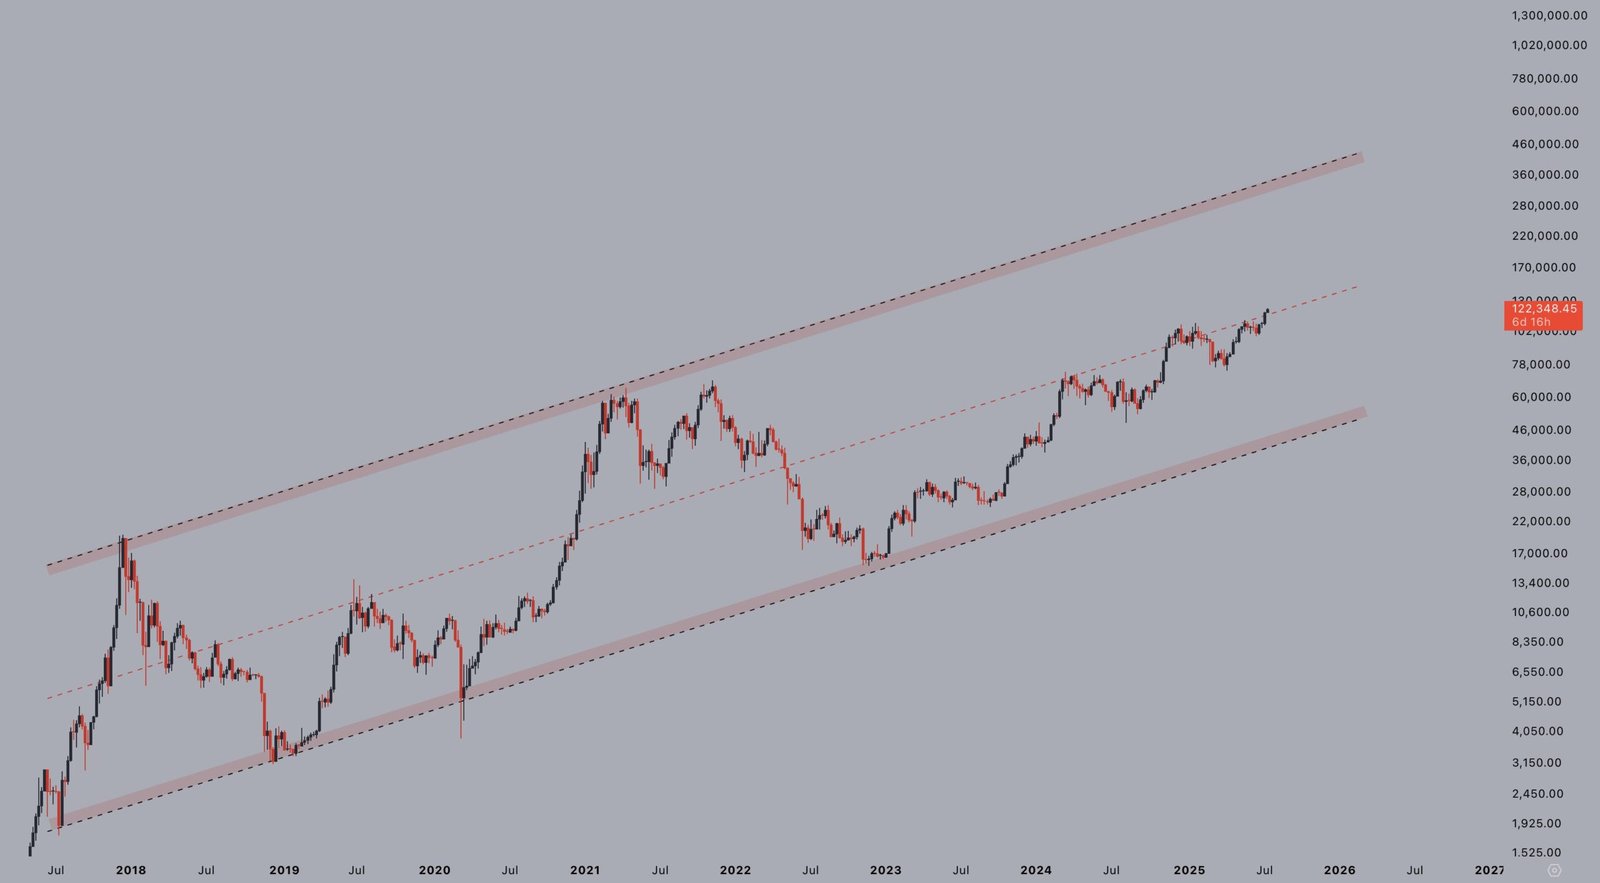
The chart shows price action since mid-2017, bounded by a wide ascending channel with clearly defined upper and lower limits. Jelle’s view places the current price near the midline, with Bitcoin attempting to reclaim the upper half of the structure.
BTC previously reached the channel top in late 2017 and again in late 2021. In both cases, those tops marked short-term cycle peaks. Now, Bitcoin is pushing into the upper region once more, suggesting strong directional pressure within a long-term trend.
The structure implies Bitcoin may continue exploring upward levels as long as price action holds within or above the centerline. The long-term chart also places the upper boundary of the channel near the $460,000 area by late 2025.
Jelle’s chart aligns with broader technical consensus showing Bitcoin sustaining a steady macro uptrend. His post adds to recent commentary about Bitcoin entering an extended growth phase following its confirmed breakout above $120,000.
Ali Highlights Disparity Between Price and Capital Inflows
On July 14, crypto analyst Ali (@ali_charts) posted a chart from Glassnode, showing Bitcoin at $117,474.54 with $51.2 billion in 30-day positive capital inflows. He compared this to Dec. 10, 2024, when BTC traded at $96,715.57 and inflows peaked at $134.9 billion. He noted the wide gap in participation, calling it a “stark difference in capital participation.”
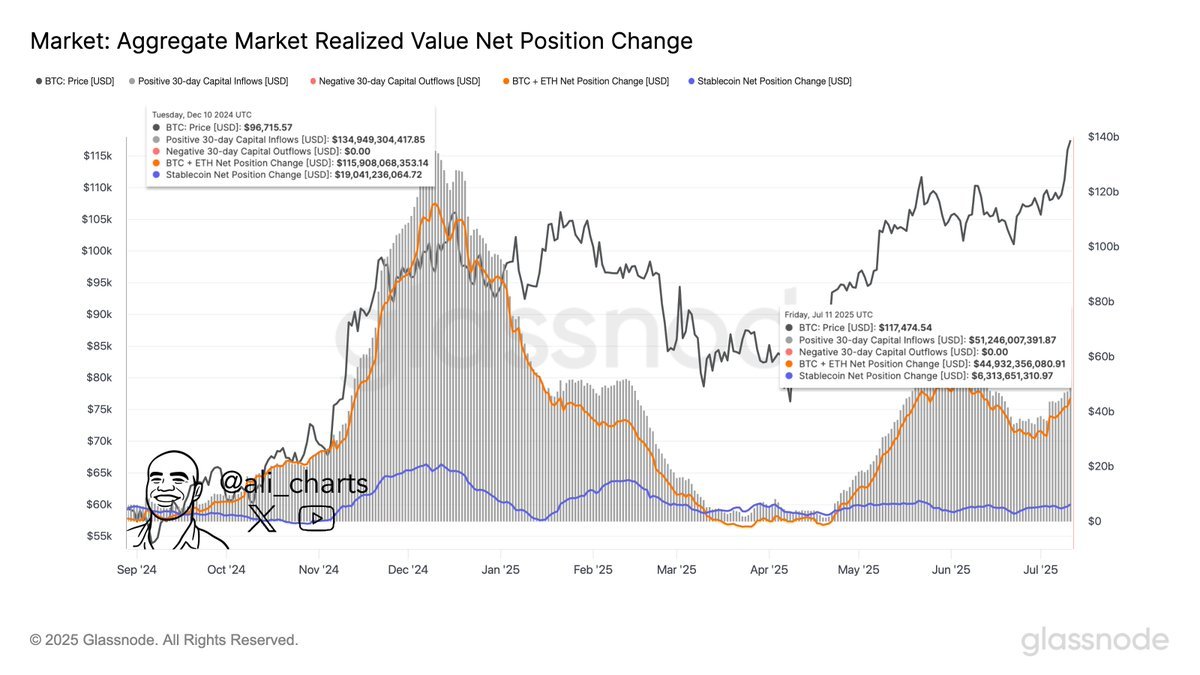
The chart illustrates realized value net position changes across BTC and ETH, alongside net flows from stablecoins. In December 2024, capital flows surged as Bitcoin neared $100,000 for the first time. Both orange and blue net position lines moved sharply upward, indicating broad institutional and retail inflows. The market saw combined BTC and ETH inflow volume above $115.9 billion, while stablecoin net positions reached $19 billion.
In contrast, July 2025 data shows BTC price near all-time highs, yet inflows remain lower. Glassnode recorded $44.9 billion in BTC and ETH inflows, and $6.3 billion from stablecoins. While positive, the values fall short of last year’s capital influx.
Ali’s post highlights the divergence between market price and capital commitment. The data suggests fewer participants are entering at current levels, despite Bitcoin’s price advancing nearly 22% since early June. The chart also shows flattened stablecoin activity, often used as a liquidity proxy, supporting the idea of reduced buying pressure.
The comparison has sparked new discussions among market observers. Some point to macroeconomic factors and tighter liquidity as reasons for slower flows. Others highlight that less capital could reflect greater price efficiency or reduced speculative volume. Either way, the divergence in capital inflow is becoming a key metric to monitor as Bitcoin approaches and tests fresh highs.