Solana’s funding rates remain in positive territory, showing that long positions still lead the market. Despite a slight price drop, traders continue paying fees to maintain long positions, signaling that most expect a rebound.
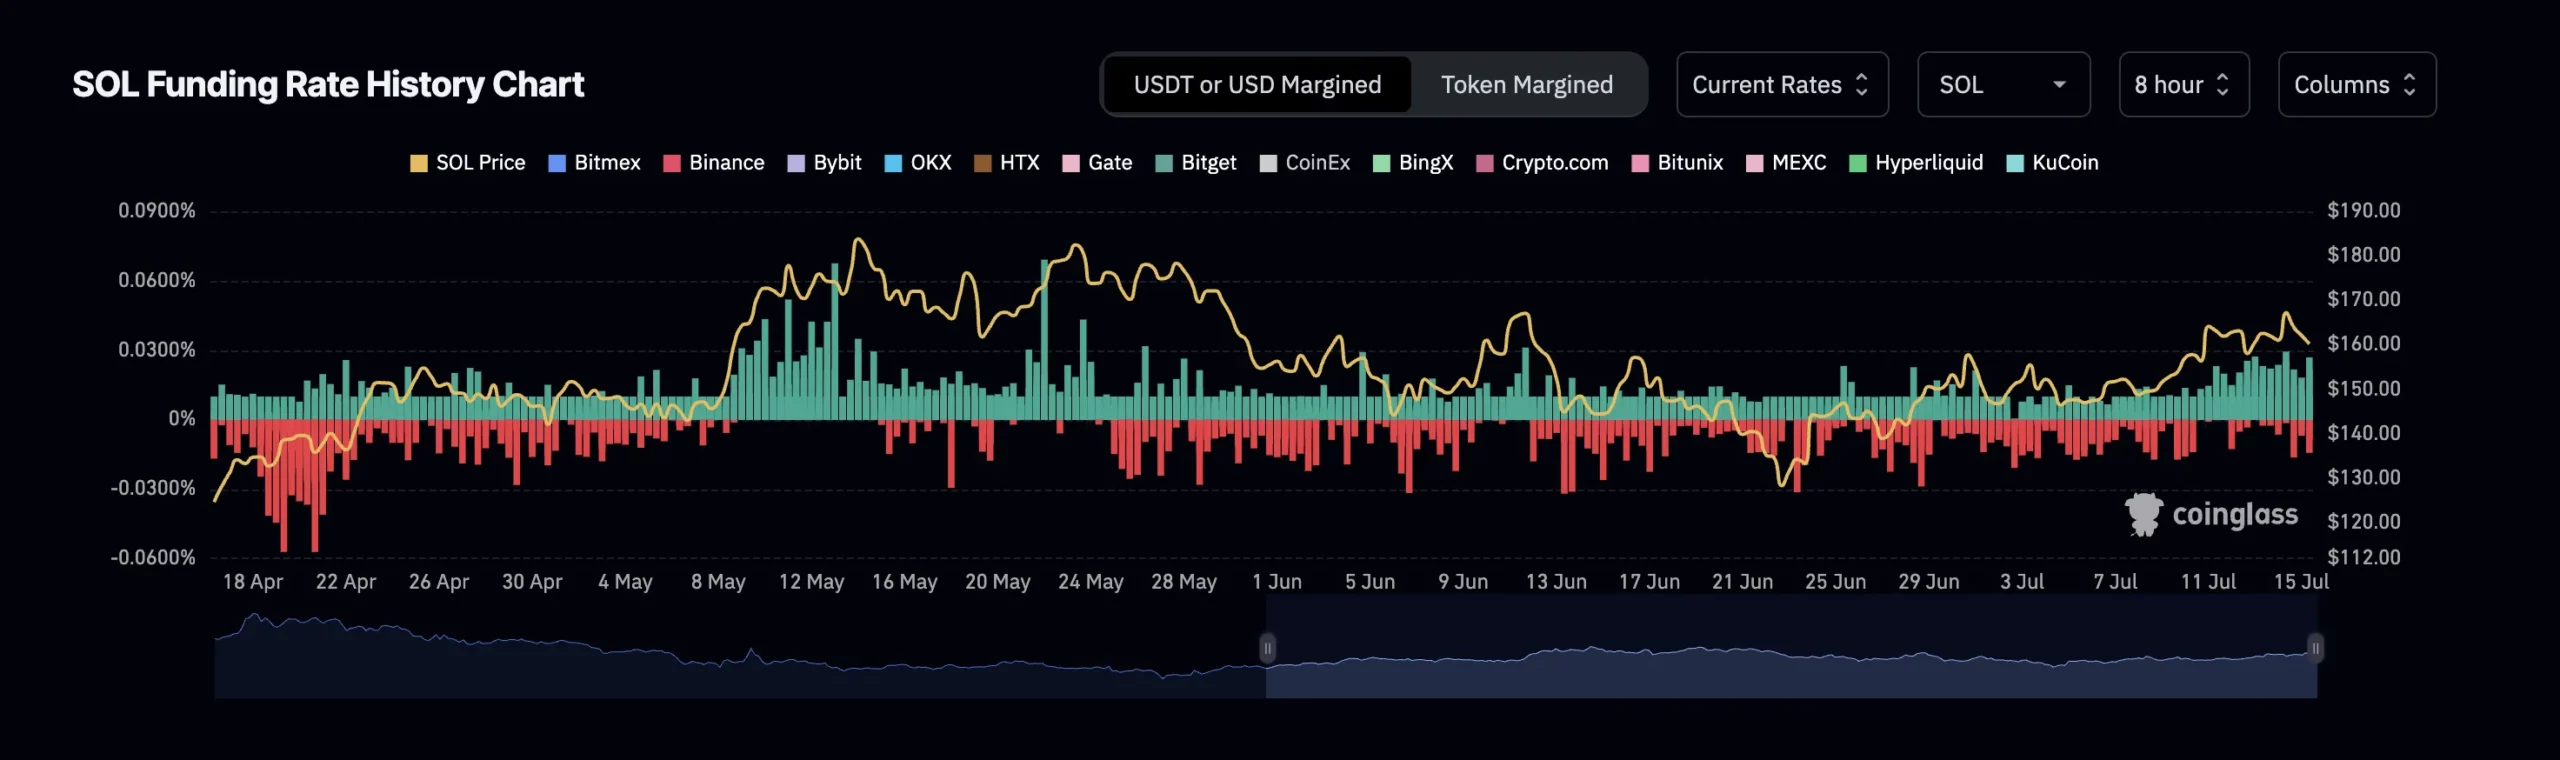
Data from Coinglass shows green bars on Solana’s funding rate chart, confirming ongoing bullish sentiment. Short sellers have yet to gain momentum, while buyers appear ready to hold through current volatility.
Funding rates are recurring payments between long and short traders in perpetual futures contracts. Positive rates mean long traders are paying shorts—indicating confidence in upward price movement.
Solana’s RWA Market Surges 140%, Nears $420M in Value
Solana’s real-world asset (RWA) market has climbed to over $418 million, marking a 140% rise since January, according to a July 15 report from Messari. This growth has positioned Solana as the fourth-largest blockchain in the RWA sector, now capturing 3.9% of the total market.
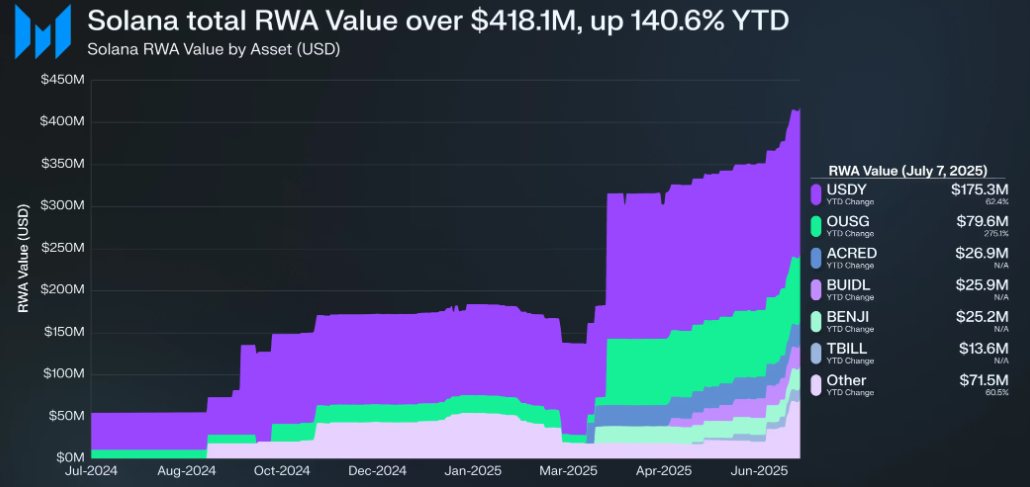
While Ethereum leads with 58.4%, followed by ZKsync Era at 17.2% and Aptos at 4%, Solana is closing in fast. Its growth far outpaces the overall RWA sector, which expanded 62.4% in 2025.
Messari credits Solana’s performance to its high-speed transactions, low fees, and developer-friendly ecosystem. The network hosts a wide range of tokenized assets, including U.S. treasuries and institutional funds.
Two major contributors to Solana’s RWA total are Ondo’s U.S. Dollar Yield Fund and ONe’s institutional fund, which together account for $277 million. Ondo alone recorded $2.7 million in 24-hour trading volume, generating protocol fees that support the Solana network.
In terms of revenue, Ethereum still dominates, posting $15.9 million in 30-day earnings. Solana followed with $3.9 million. However, growth trends show newer chains gaining ground. Aptos grew its RWA value by 52.7% in the past month, while Solana rose 14.6%, both exceeding Ethereum’s 3.6% increase.
The total RWA market now stands above $25 billion, as institutions continue adopting tokenized solutions for faster settlement and broader access.
Solana Breaks Out of Bullish Flag, Eyes 44% Upside Toward $231
As of July 15, 2025, Solana SOL/USDT has confirmed a bullish flag breakout on the daily chart. A bullish flag is a continuation pattern that forms after a sharp upward move, followed by a brief downward-sloping consolidation channel. Once the price breaks above the flag’s resistance, it often signals the resumption of the prior uptrend.
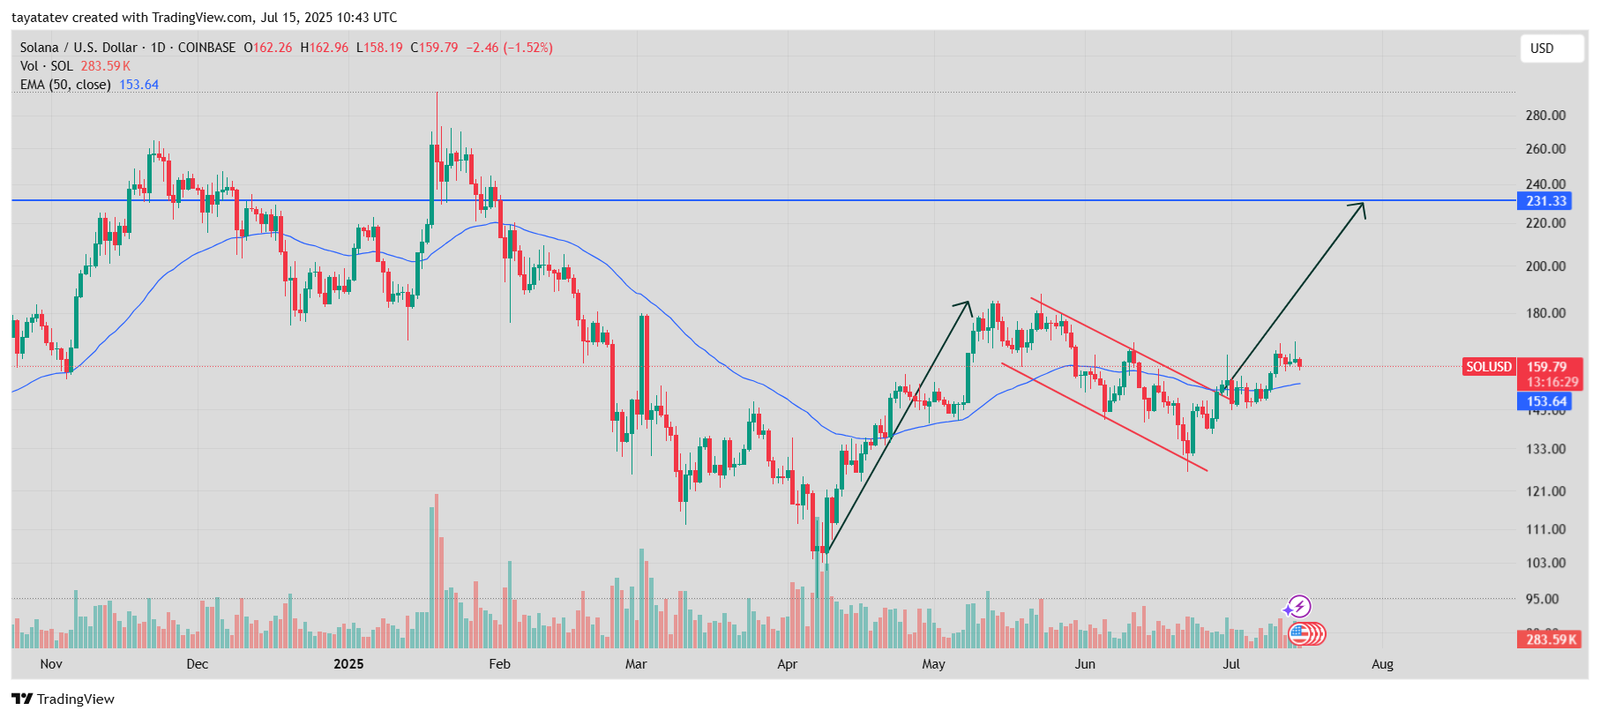
In this case, SOL rallied strongly in early May, then moved within a tight downward-sloping flag until early July. The breakout has already occurred, and SOL is now trading at $159.79—up roughly 5% from the breakout level.
If the breakout sustains, the pattern projects a target near $231. This would mark a potential 44% rise from the current price. The 50-day exponential moving average, now sitting at $153.64, continues to provide support from below, reinforcing bullish momentum.
Volume also shows healthy participation during the breakout, and the price is holding above both the flag structure and moving average. Unless invalidated by a sharp reversal, this setup points to extended upside in the sessions ahead.
Solana Balance of Power Turns Negative, Signals Weak Buyer Control
As of July 15, 2025, Solana’s Balance of Power (BoP) indicator stands at -0.55, signaling bearish pressure in the market. The Balance of Power measures the strength of buyers versus sellers, helping identify whether bulls or bears dominate a given period. Values below zero show sellers have control, while values above zero indicate buyer dominance.
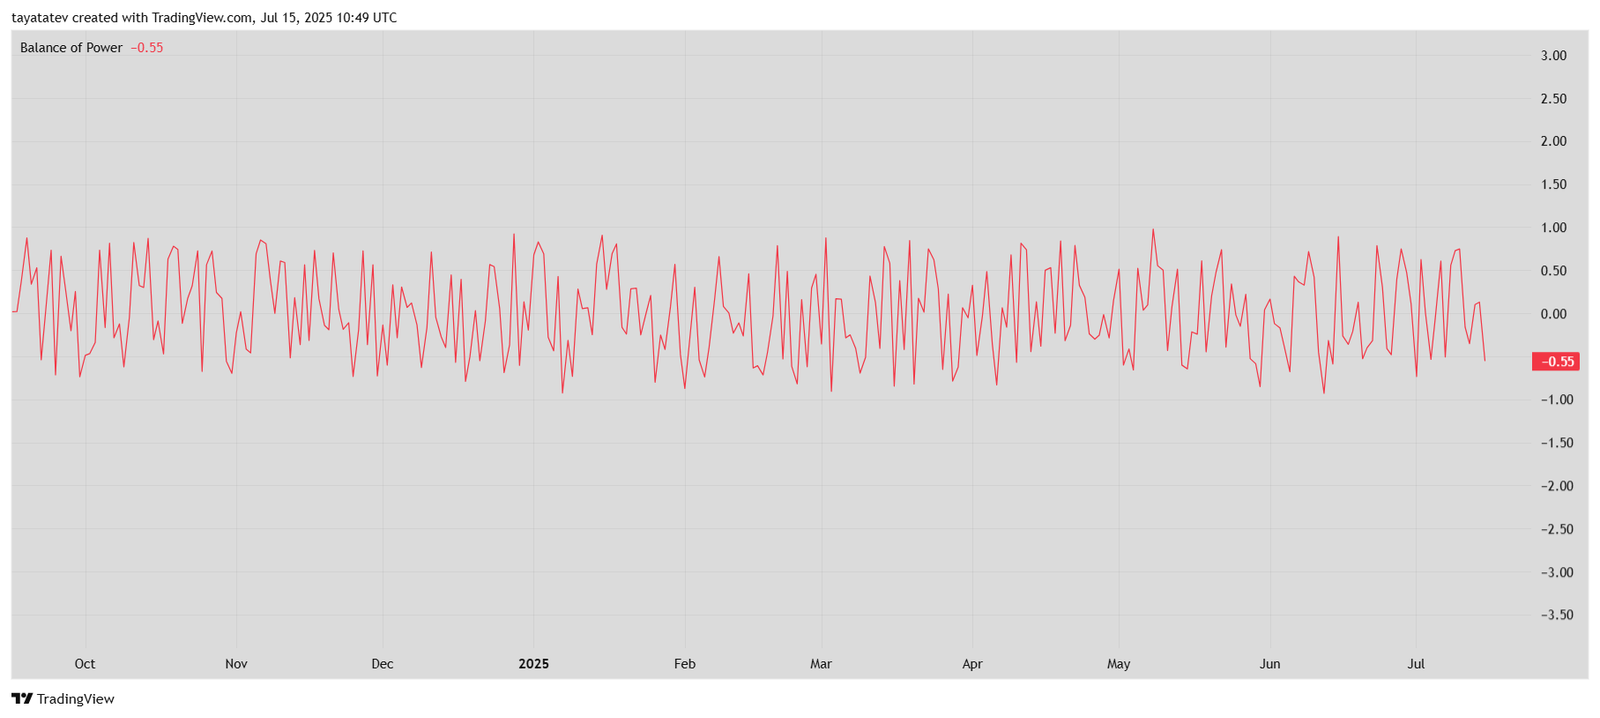
Currently, the negative BoP reading confirms that sellers are outweighing buyers in momentum. The steady decline in BoP since early July aligns with a short-term loss of bullish strength, despite the recent breakout from the bullish flag pattern.
Although Solana’s price still trades above the 50-day exponential moving average, the weakening BoP may lead to more consolidation or a pullback if selling pressure increases. Traders often watch for a return above the zero line to confirm that buyers are regaining control. Until then, the BoP trend adds caution to the overall bullish setup.
Solana RSI Hovers Above 56, Momentum Still Favors Bulls
Solana’s Relative Strength Index (RSI) on the daily chart stands at 56.23, while the RSI moving average is at 54.75. The RSI is a momentum oscillator that measures the speed and magnitude of price movements, typically used to identify overbought or oversold conditions. Readings above 50 indicate bullish momentum, while levels below 50 suggest bearish control.
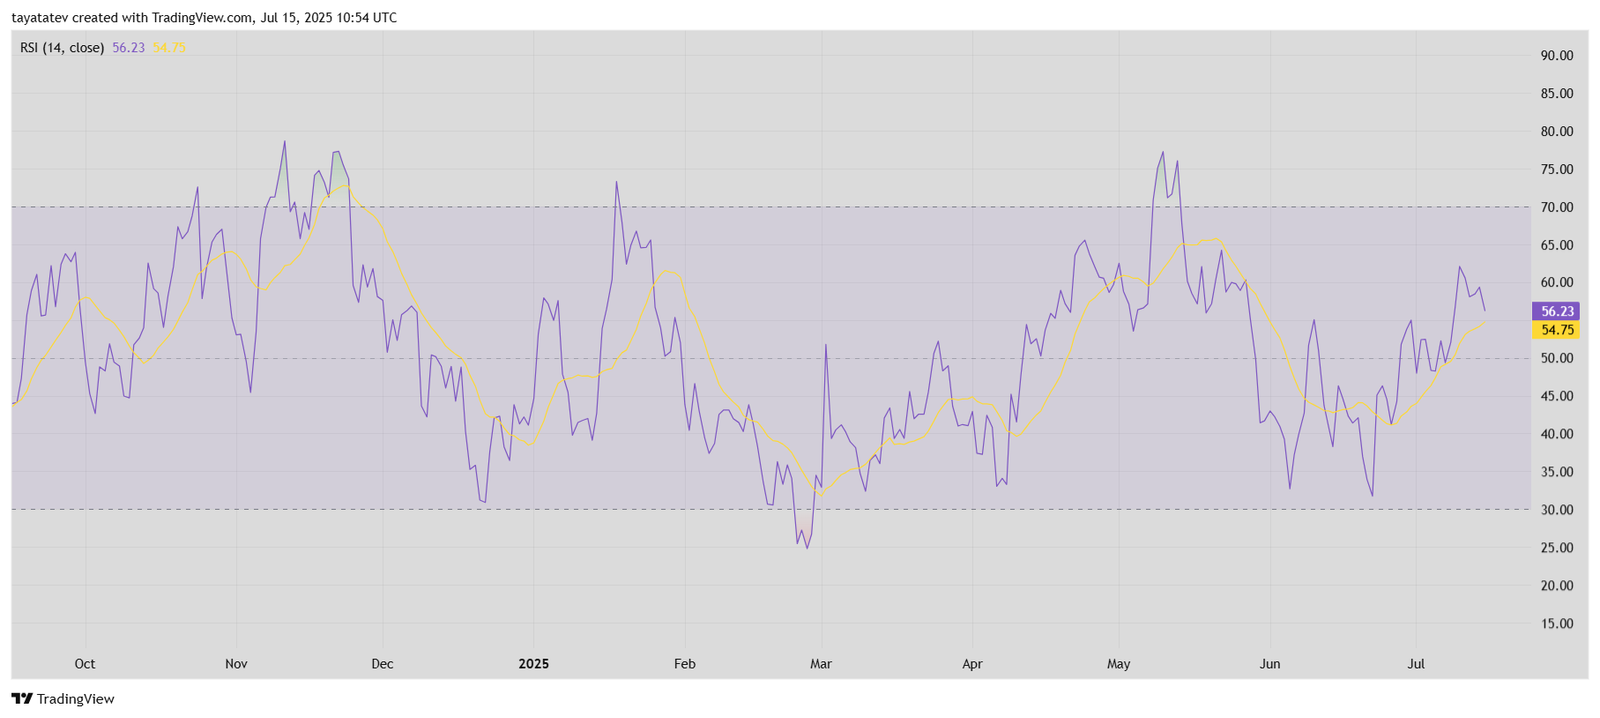
Currently, the RSI remains above its moving average and above the neutral 50 mark, signaling that buyers still hold slight momentum. However, the RSI has pulled back from the overbought zone near 70, showing that upward strength has slowed.
Momentum remains positive, but not aggressive. If RSI continues rising above 60, it could reinforce Solana’s bullish breakout. On the other hand, a drop below the 50 level would reflect waning buyer interest and possibly trigger a price consolidation or minor pullback.
At this stage, RSI supports moderate bullish strength without signaling overextension.
Solana MACD Turns Bullish as Signal Line Crossover Confirms Uptrend
As of July 15, 2025, Solana’s Moving Average Convergence Divergence (MACD) indicator shows clear bullish momentum. The MACD line (blue) has crossed above the signal line (orange), now reading 3.07 versus 1.79. This crossover confirms a bullish trend shift and reflects strengthening upward momentum.
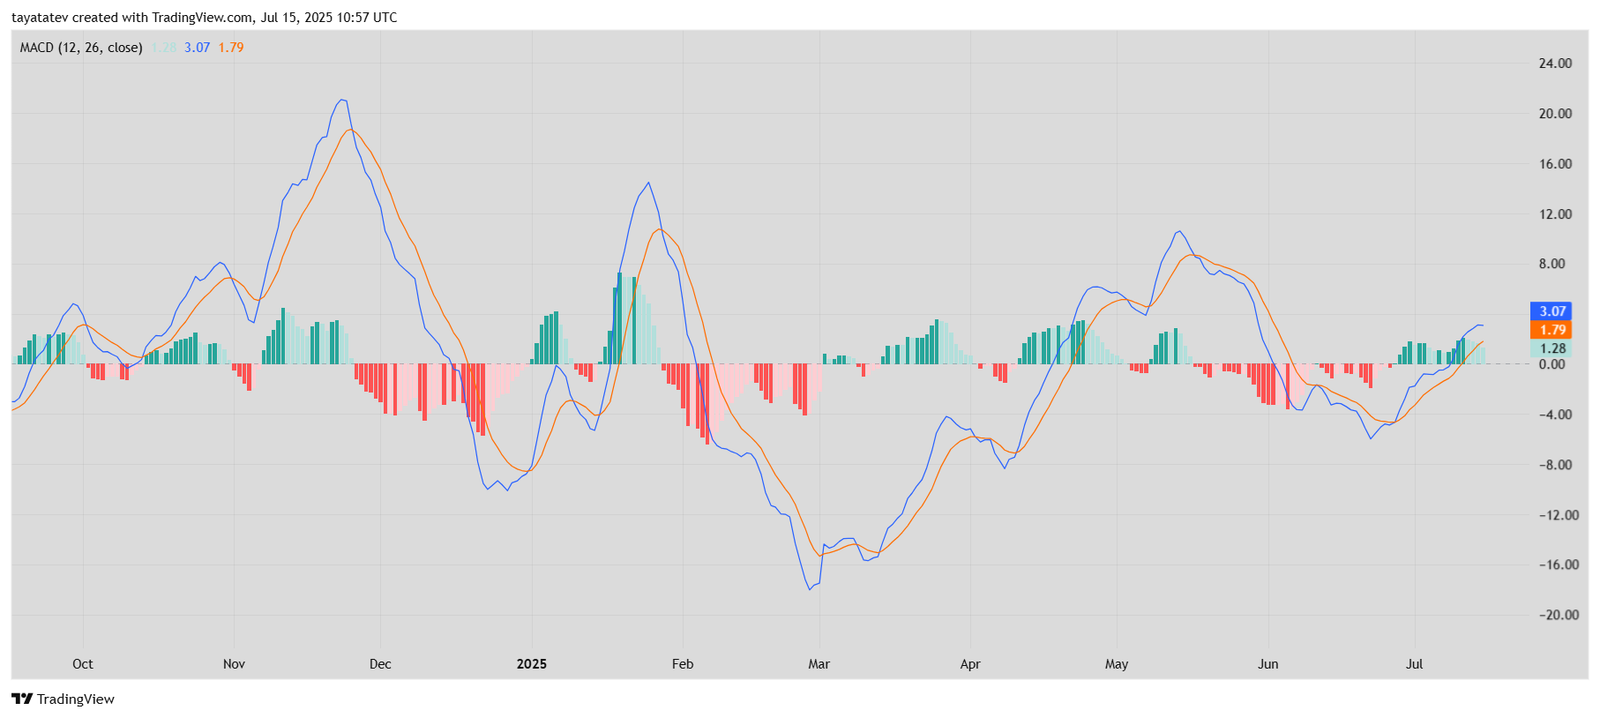
The MACD histogram has also turned positive, climbing above the zero line. This signals growing distance between the MACD and signal lines—another indicator that buying strength is building. When the histogram remains above zero and rising, it often points to sustained upward pressure.
This technical setup aligns with Solana’s breakout from the bullish flag pattern on the daily chart. If the MACD trend continues, it could reinforce the current rally and support a push toward the $231 target area. Until then, momentum favors buyers, with the MACD suggesting further upside is likely as long as the crossover holds.
