վDIA Skyrockets 117% After Randamu Deal, Breaks Multi-Year Resistance With Bullish Momentum
SHARE
DIA and Randamu have expanded their partnership to offer enterprise-grade onchain randomness through DIA’s trustless oracle platform, Lumina. The two firms will now deliver secure, auditable random number generation (RNG) services directly to institutional clients.
DIA needed secure RNG tools that are fully on-chain, cryptographically verifiable, and resistant to tampering. Its goal was to strengthen trust guarantees for its financial data feeds. At the same time, Randamu wanted to grow adoption of its drand-powered randomness solutions in commercial and institutional markets.
- Advertisement -
The new collaboration solves both issues. Now, Randamu’s decentralized randomness feeds will run across DIA Lumina, allowing financial institutions to integrate secure RNG for key operations like onchain lotteries, risk modeling, and oracle responses.
Direct Integration Into DIA Lumina
The two companies have integrated Randamu’s drand randomness protocol into DIA’s oracle layer. This setup delivers publicly verifiable, unbiased randomness directly onchain. As a result, users can audit the outputs in real time, ensuring transparency and security.
Samuel Brack, CTO of DIA, said the upgrade allows the platform to better serve its institutional clients.
- Advertisement -
“Randamu’s secure randomness tech strengthens our oracle feeds and supports our clients’ critical operations with maximum trust,”
he said.
Yolan Romailler, Chief Cryptographer at Randamu, added,
“This commercial rollout brings our drand-based services to a new class of enterprise users, increasing transparency across both DeFi and TradFi.”
Unlocking Enterprise-Level Benefits
By joining forces, DIA and Randamu aim to meet strict institutional requirements for randomness, verification, and data security. Their integration helps financial players deploy high-assurance applications without relying on centralized tools.
The companies also plan to support long-term adoption of decentralized RNG tools across blockchains, financial apps, and enterprise networks. This collaboration positions both partners to offer cryptographic infrastructure designed for the future of secure onchain finance.
DIA Explodes 117% in 3 Days, Breaks Year-Long Resistance
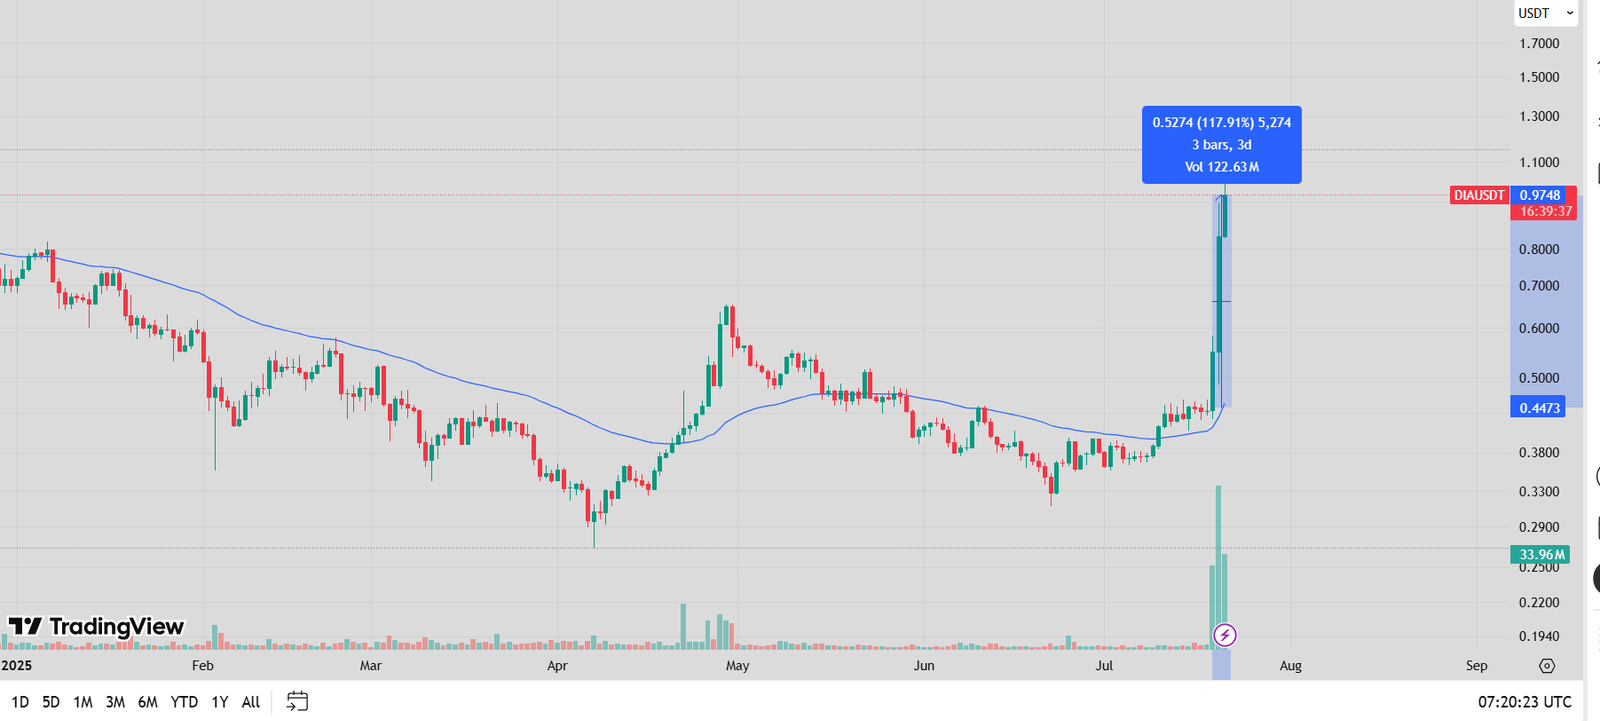
DIA jumped 117.91% in just three days, gaining $0.5274. The move pushed DIA to a local peak near $0.97. This breakout followed months of consolidation between $0.20 and $0.45. The surge broke past the previous resistance at $0.52, confirming strong bullish momentum.
DIAUSDT Price Surge. Source: TradingView
The price had struggled below that range for most of 2025, but this breakout marks the strongest upward move this year. The rally shows aggressive demand, with DIA doubling in a short window.
DIA Clears Golden Pocket, Reclaims Key Levels With 371% Rally
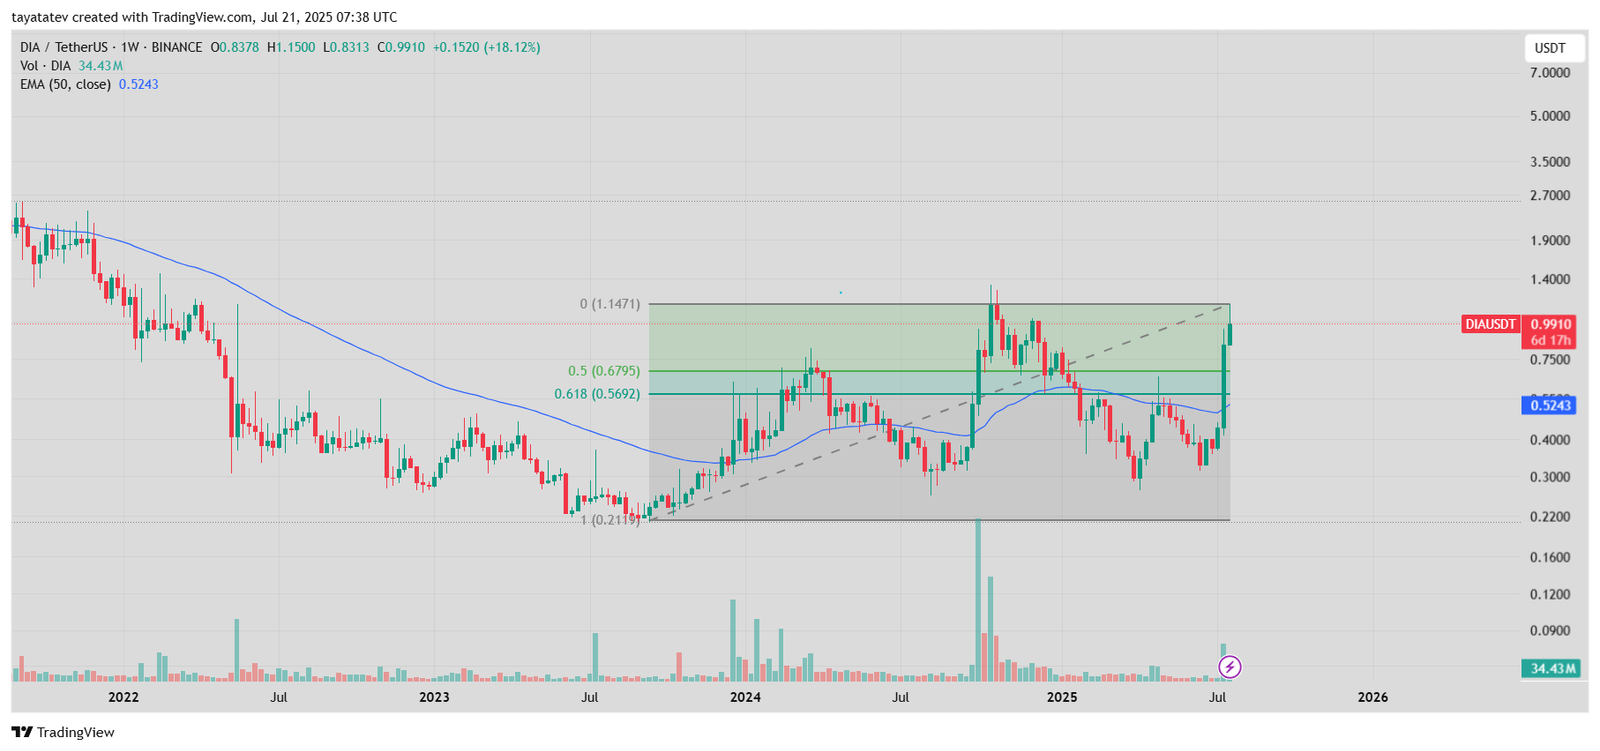
DIA surged to $0.9910 after gaining over 371% from its 2022 low of $0.2119. The weekly DIA/USDT chart shows a clean breakout through major Fibonacci levels, with strong volume support and a confirmed move above the 50-week EMA.
DIA Fibonacci Breakout With Volume Confirmation. Source: TradingView
The Fibonacci retracement, drawn from the low of $0.2119 to the high of $1.1471, outlines a critical resistance zone between $0.5692 (0.618 level) and $0.6795 (0.5 level). This area, known as the golden pocket, often acts as a turning point. DIA had rejected this zone twice in 2024. However, the latest weekly candle broke above both lines, marking a significant shift in structure.
Volume surged to 34.43 million, the highest since early 2024. This increase confirms strong participation behind the move and adds conviction to the breakout. In past rallies, lower volume often led to fakeouts. This time, the volume spike coincides with price expansion, suggesting genuine buying pressure.
At the same time, the price has moved decisively above the 50-week EMA, which currently sits at $0.5243. DIA had traded below this EMA for most of the past two years. Reclaiming this moving average and holding above it signals the start of a new upward trend.
DIA now trades inside a horizontal resistance zone between $0.95 and $1.15. This area blocked several rallies in 2024 and served as the final ceiling before the $1.1471 peak. If DIA closes a weekly candle above $1.15, the next phase of the uptrend may begin.
As long as the token stays above the $0.68 zone—the top of the golden pocket—bulls are in control. The confluence of volume strength, Fibonacci structure, and EMA reclaim points to growing upside potential.
DIA Weekly MACD Flips Bullish as Momentum Builds
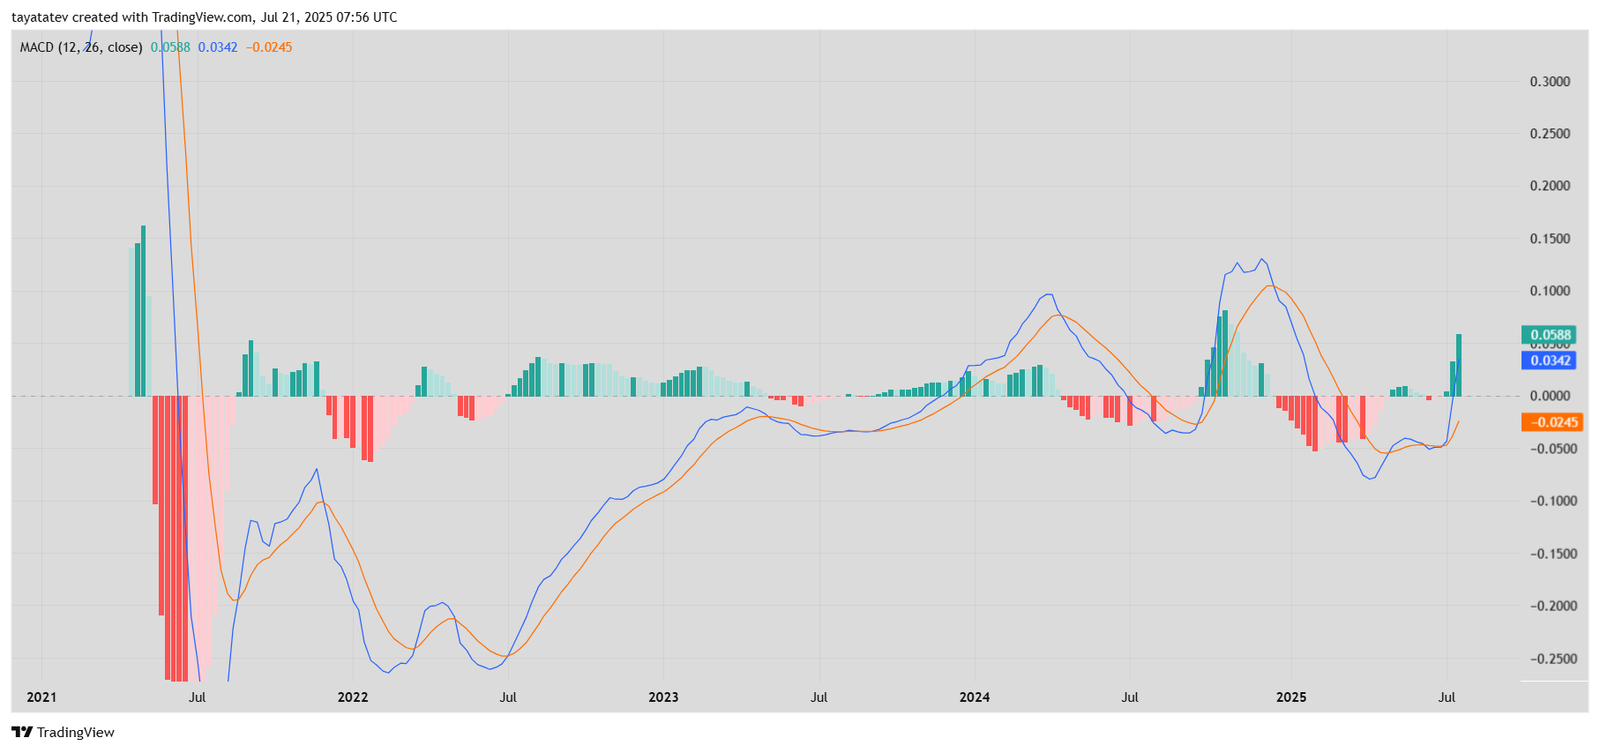
DIA’s weekly MACD (Moving Average Convergence Divergence) just confirmed a bullish crossover, supporting the token’s recent breakout. After months of negative momentum, the indicator has flipped into positive territory for the first time since early 2024.
DIAUSDT Weekly MACD Chart. Source: TradingView
The MACD line (blue) crossed above the signal line (orange), showing a shift in momentum from bearish to bullish. At the same time, the histogram turned green and climbed above the zero line, indicating that buying strength is accelerating.
This crossover comes after a prolonged bearish phase that lasted from late 2024 through mid-2025. During that period, the MACD histogram printed a long series of red bars while both lines stayed below zero. That environment suggested persistent selling pressure and lack of trend strength.
Now, the shift in the MACD structure confirms what the price chart already shows—a reversal from the bottom and a clear breakout above key resistance levels. The MACD value now stands at +0.0588, while the signal line remains slightly lower at +0.0342. This spread indicates growing upside momentum.
The bullish MACD structure also aligns with the recent volume spike and the breakout above the golden pocket range on the Fibonacci retracement. Together, these signals reinforce the strength of the current uptrend and suggest that momentum is likely to continue building.
DIA Weekly RSI Enters Overbought Zone for First Time Since 2021
DIA’s Relative Strength Index (RSI) has surged to 71.31 on the weekly chart, marking its first entry into overbought territory in over four years. This move reflects extreme bullish momentum, confirming the strength behind the token’s recent price breakout.
DIAUSDT Weekly RSI Chart. Source: TradingView
The RSI measures the speed and magnitude of price movements. Readings above 70 typically signal overbought conditions, while values below 30 indicate oversold zones. On July 21, DIA crossed the 70 line, a level it had not touched since early 2021.
This sharp rise comes after a long period of weak momentum. For most of 2023 and the first half of 2025, DIA’s RSI remained below 50, reflecting sideways action and weak trends. The recent acceleration from an RSI of 35 to 71 happened in just a few weeks, highlighting how aggressively buying pressure has returned.
Additionally, the RSI has crossed above its moving average (currently at 49.05), confirming that momentum is not only strong but also building at a fast pace. This crossover supports the trend shift already seen on DIA’s MACD, volume, and price structure.
While an RSI above 70 can suggest the asset is overheating, in strong uptrends it often stays elevated for extended periods. Therefore, this breakout adds to the list of signals confirming DIA’s bullish reversal.
Tatev Avetisyan is a Markets Writer and Analyst at CoinChapter, covering cryptocurrency markets, policy, and regulation. With over seven years of experience in business and marketing development, she has spent the past two years specializing in digital assets and has authored more than 2,000 articles on crypto markets and regulatory developments.She contributes as a guest writer to leading industry publications and is a prominent Web3 advocate in Armenia through Web3Armenia. Her work reflects a broader focus on artificial intelligence and Web3 technologies.
Tatev maintains a diversified crypto portfolio, with Bitcoin as her primary holding above CoinChapter’s $1,000 disclosure threshold.