
The latest market momentum signals that altcoin season may have arrived. While Bitcoin holds steady and Ethereum sees moderate gains, memecoins on the Solana blockchain are showing outsized moves. Trading volume, price breakouts, and renewed retail interest have shifted attention to lower-cap tokens delivering strong technical setups.
Among these, Solana-based memecoins are gaining traction with distinctive price structures and clear continuation patterns. From clean breakouts to defined channels, these coins are not just riding hype—they’re following charts that traders can read and act on.
Lets see three Solana memecoins that are standing out in current market conditions: PNGU, TRUMP, and FARTCOIN. All three are displaying strong bullish formations and pointing to further upside if patterns play out as expected. Let’s break down each chart setup.
PENGU Breaks Out From Bullish Pennant Pattern on July 21
The PENGU/USDT chart shows that a bullish pennant pattern formed between July 14 and July 21, 2025. This pattern appeared after a strong upward move and was followed by price consolidation between two converging trendlines. A bullish pennant is a continuation pattern that forms after a steep rise, then pauses in a tight range, and finally breaks out upward as buyers regain control.
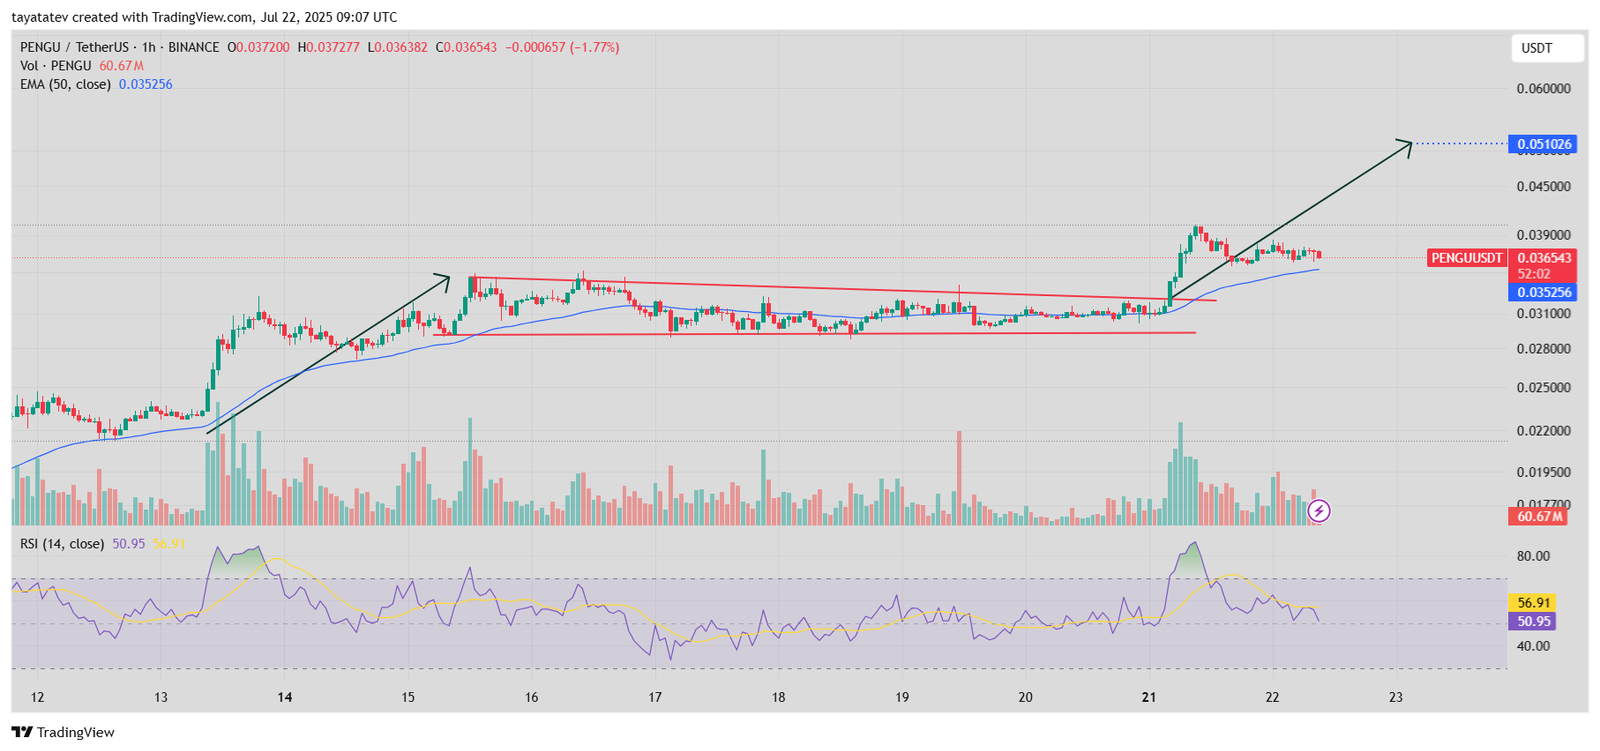
On July 21, PENGU broke out of the pennant. The breakout pushed the price up nearly 10% from the pattern’s upper trendline, confirming bullish momentum. The breakout candle showed strong volume, and the price remained above the 50-hour exponential moving average (EMA), which currently stands at $0.035256.
The Relative Strength Index (RSI) was around 56.91 at the time of the breakout and cooled to 50.95 by July 22, indicating room for more upward movement without being overbought. Based on the pennant’s pole length and breakout projection, the expected target lies around $0.051026. This implies a potential additional 40% increase from the current price of $0.036543.
The price action continues to respect the ascending structure. The higher lows and strong buying volume signal sustained bullish strength. As long as PENGU holds above the EMA and doesn’t fall back into the consolidation zone, the upward trajectory remains valid. The chart reflects growing market interest with volume spikes and consistent price support.
This setup shows bullish continuation after a clear breakout, suggesting that traders are still pushing higher targets for PENGU.
TRUMP Token Builds Rising Channel Pattern, Eyes 26% Move Toward $13.51
The TRUMP/USDT chart shows a rising channel pattern formed between July 14 and July 22, 2025. This pattern is made of two straight lines sloping upward. One connects the highs, and the other connects the lows. As long as the price stays inside these two lines, it shows that buyers are slowly pushing the price higher over time. A rising channel often appears when a coin takes a short break before continuing to rise.
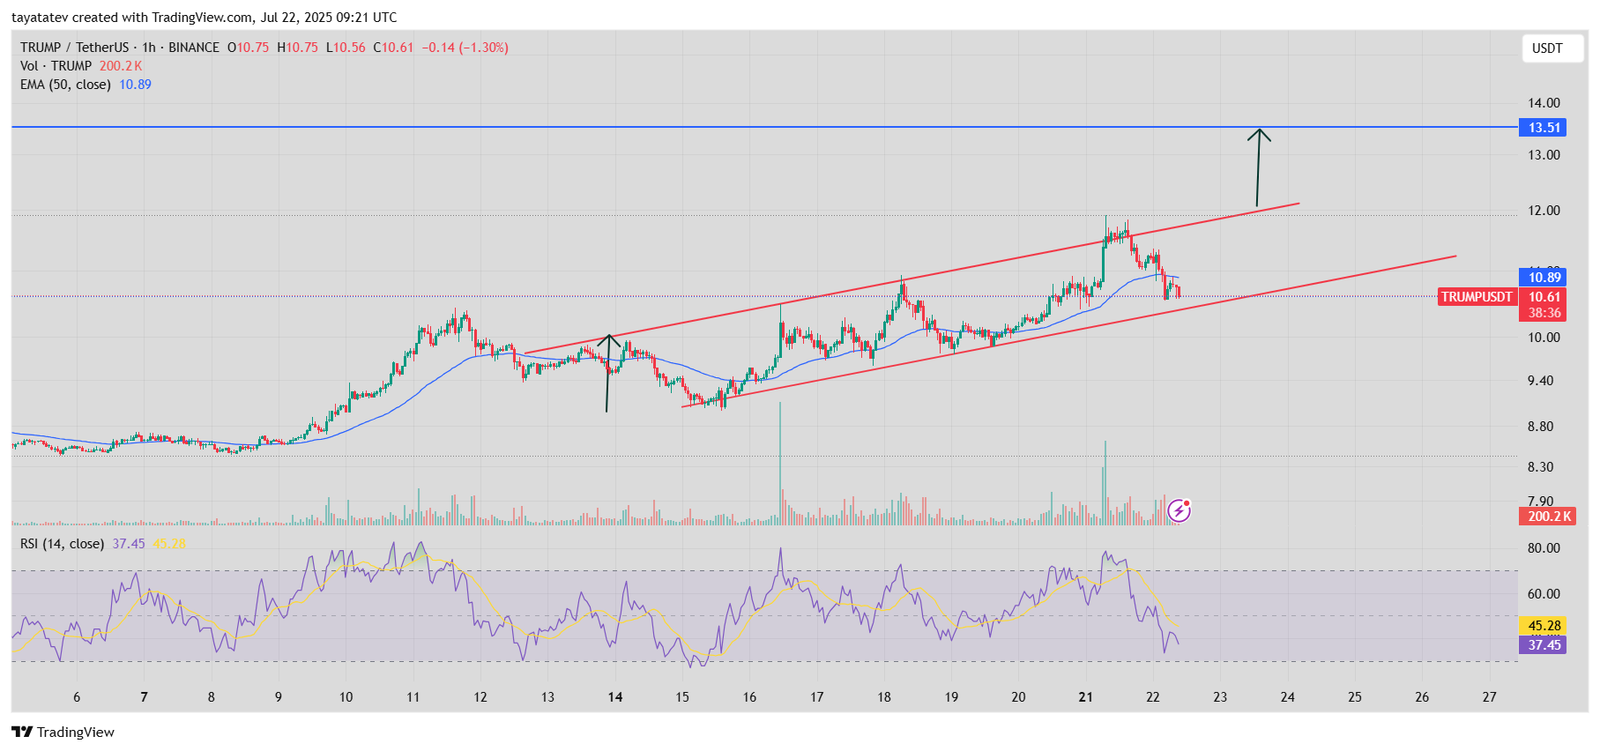
In this case, the price has touched both the top and bottom of the channel multiple times, which confirms the pattern. The price recently dropped slightly but still stays inside the channel, meaning the pattern is still valid. The 50-hour exponential moving average (EMA), which helps show the average price over time, is now very close to the price. This usually acts like a short-term support zone.
The Relative Strength Index (RSI), which helps measure if a coin is overbought or oversold, is now below 40. This means the token might be oversold and could bounce back soon.
If the token continues moving within the rising channel and breaks above the upper red line, the chart suggests that the next move could take the price up 26% from here. That would place the next key target at $13.51. This possible move would confirm that buyers are still in control.
So far, the price action, volume, and RSI all support the idea that the coin could continue climbing. The structure of the rising channel remains strong, and as long as the price stays inside this pattern, it keeps a bullish outlook.
FARTCOIN Forms Ascending Channel, Aims for 30% Gain Toward $2.11
The FARTCOIN/USDT chart, created on July 22, 2025, shows a clear ascending channel pattern. This setup began forming around June 24 and continues to guide price movement. An ascending channel appears when a token makes higher highs and higher lows between two upward-sloping trendlines. It usually signals steady buying pressure and a healthy uptrend.
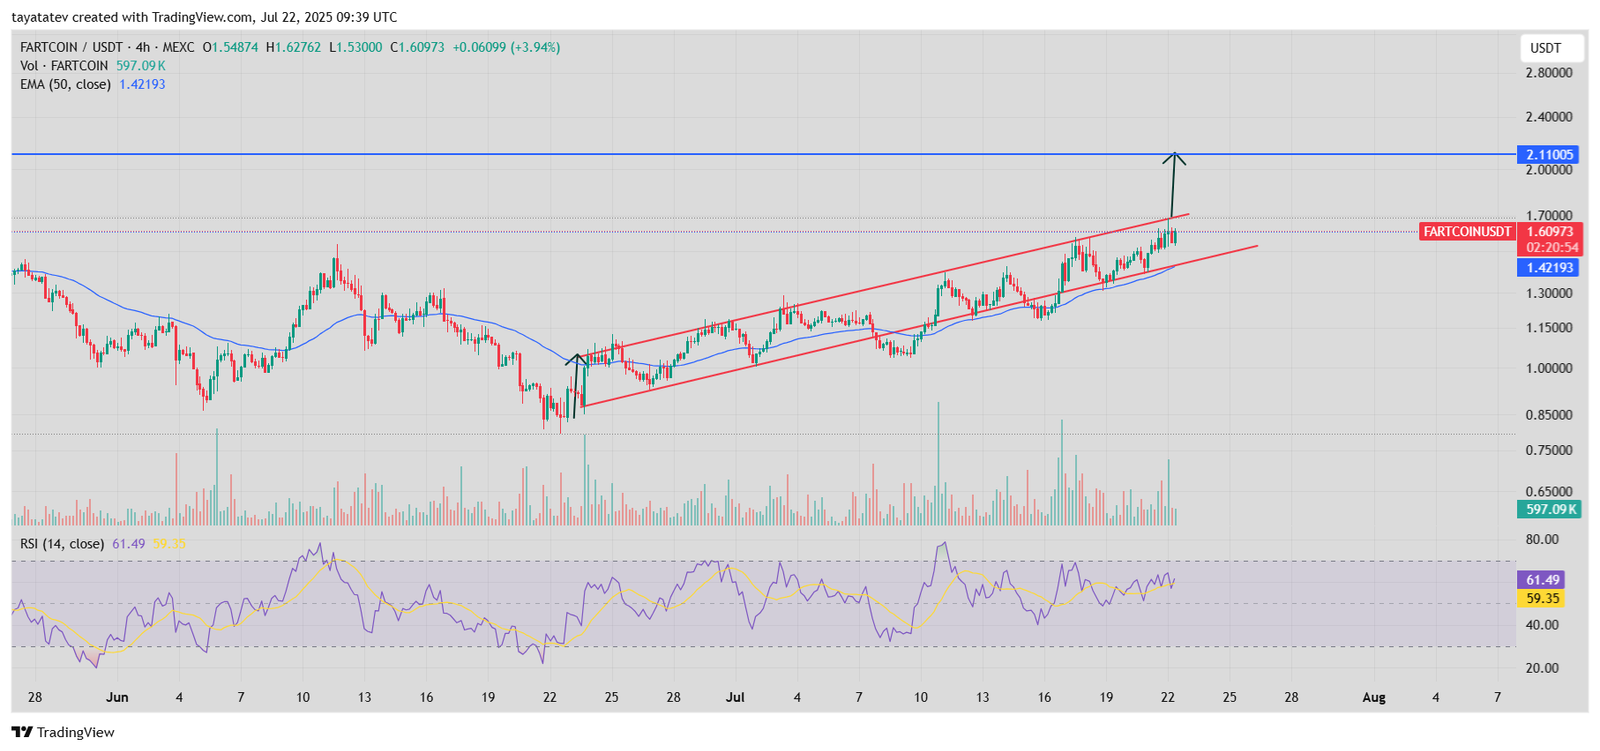
The price currently trades near the top of the channel while staying well above the 50-period exponential moving average (EMA), which sits at $1.42193. This EMA line acts like a support zone, showing that buyers have stayed in control during recent pullbacks.
The volume shows consistent participation, especially during upward moves, which supports the strength of this pattern. The Relative Strength Index (RSI) now reads 61.49, close to the overbought level but still under the warning zone. This tells us there is still space for more upward movement before the token becomes overbought.
If the price continues to follow this ascending channel and breaks through the top trendline, the target moves to $2.11. That would be a 30% rise from the current area. This level lines up with the height of the previous wave projected above the channel.
Momentum remains strong, and as long as the price holds the lower boundary and EMA support, the uptrend is likely to continue. The structure of the channel, rising volume, and RSI position all confirm that buyers still have control.
