
Crypto Joe flagged a falling wedge breakout on Dogecoin’s 30-minute chart, calling for a short-term move to $0.2892.
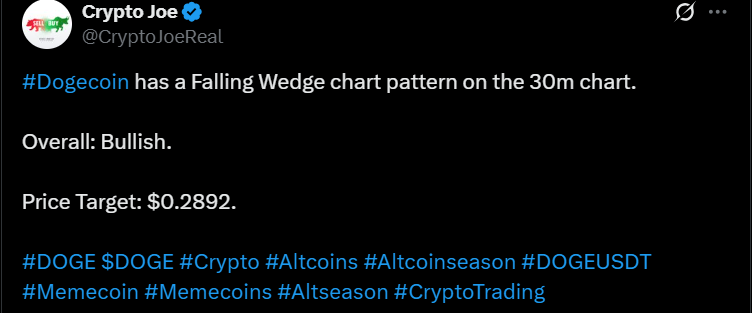
The wedge pattern, formed by converging trendlines during a downtrend, was followed by a mild breakout above $0.266. While volume rose at the breakout, confirmation on higher timeframes is still lacking, and the pattern’s shallow slope raises questions about strength. That said, the breakout aligns with DOGE’s recent momentum, making Joe’s target reasonable in the near term.
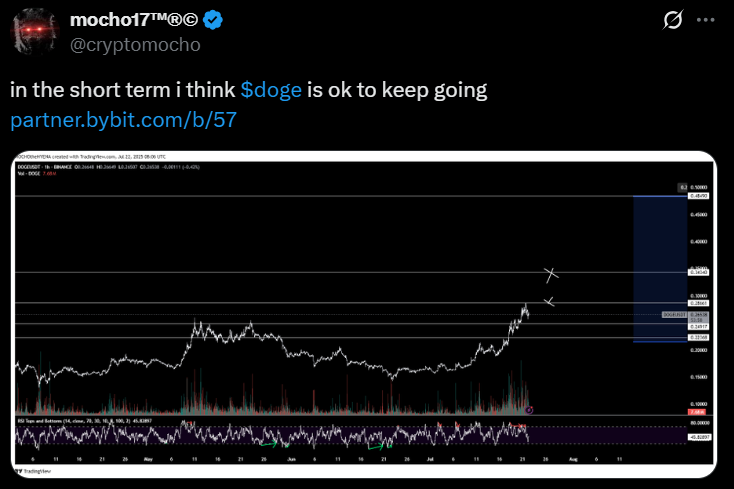
Mocho17, an X-based trader, offered a cleaner breakout view from a higher timeframe, identifying two resistance zones near $0.31 and $0.36. The analyst’s post suggested that DOGE has room to run, though it stopped short of forecasting a parabolic move. The chart structure supports a slow grind upward, assuming bulls can hold above the $0.26–$0.27 demand area.
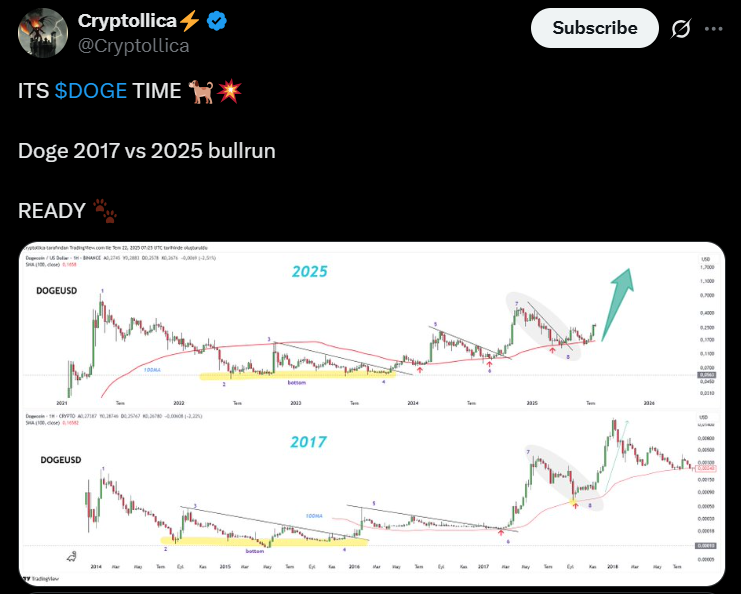
Meanwhile, another crypto analyst, Cryptollica, compared the current DOGE cycle to the 2017 bull run. The chart highlighted near-identical accumulation and breakout phases across both cycles.
While fractal comparisons are often visually persuasive, they rely heavily on sentiment and macro market context repeating itself, which rarely happens with precision. Still, the resemblance points to a possible continuation phase if DOGE can reclaim the $0.30–$0.35 range with volume.
CryptoSiyam went much further, projecting a cup-and-handle formation with a $5.00 target. That target isn’t grounded in historical breakout ratios. Even a bullish outcome from the handle breakout would typically imply a move closer to $1.00–$1.50—not a 20x jump.
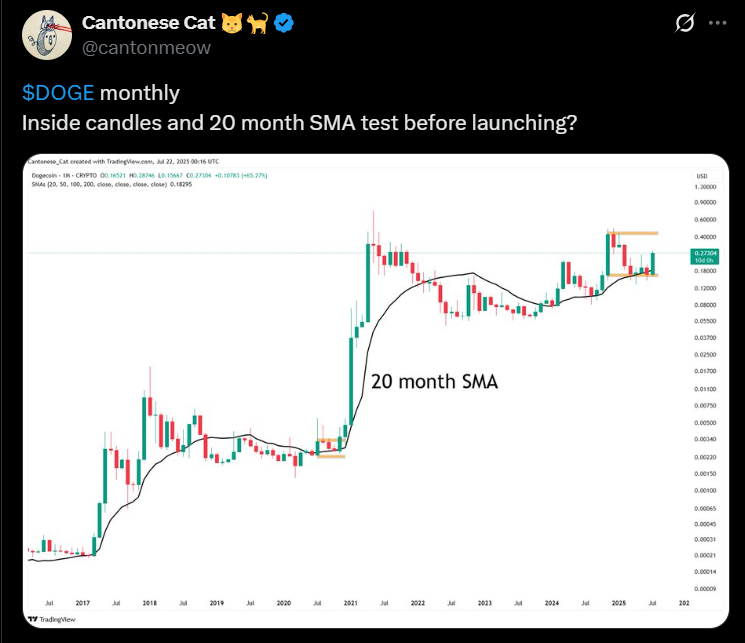
Cantonese Cat’s post noted DOGE’s successful retest of the 20-month simple moving average. This signal preceded major rallies in the past and carries more weight than speculative targets alone.
Whale Wallets Shrink While Mid-Term Holders Step In
The following is author’s analysis of onchain metrics, and should not be taken as financial advice in any way. Readers are advised to do their own research before investing anything.
Despite Dogecoin’s 110% surge between June 21 and July 21, on-chain data shows a mixed accumulation picture. Glassnode’s HODL Waves chart reveals a sharp rise in the 6–12 month holding band, signaling that a large chunk of recent buyers are holding onto their coins rather than rotating out.
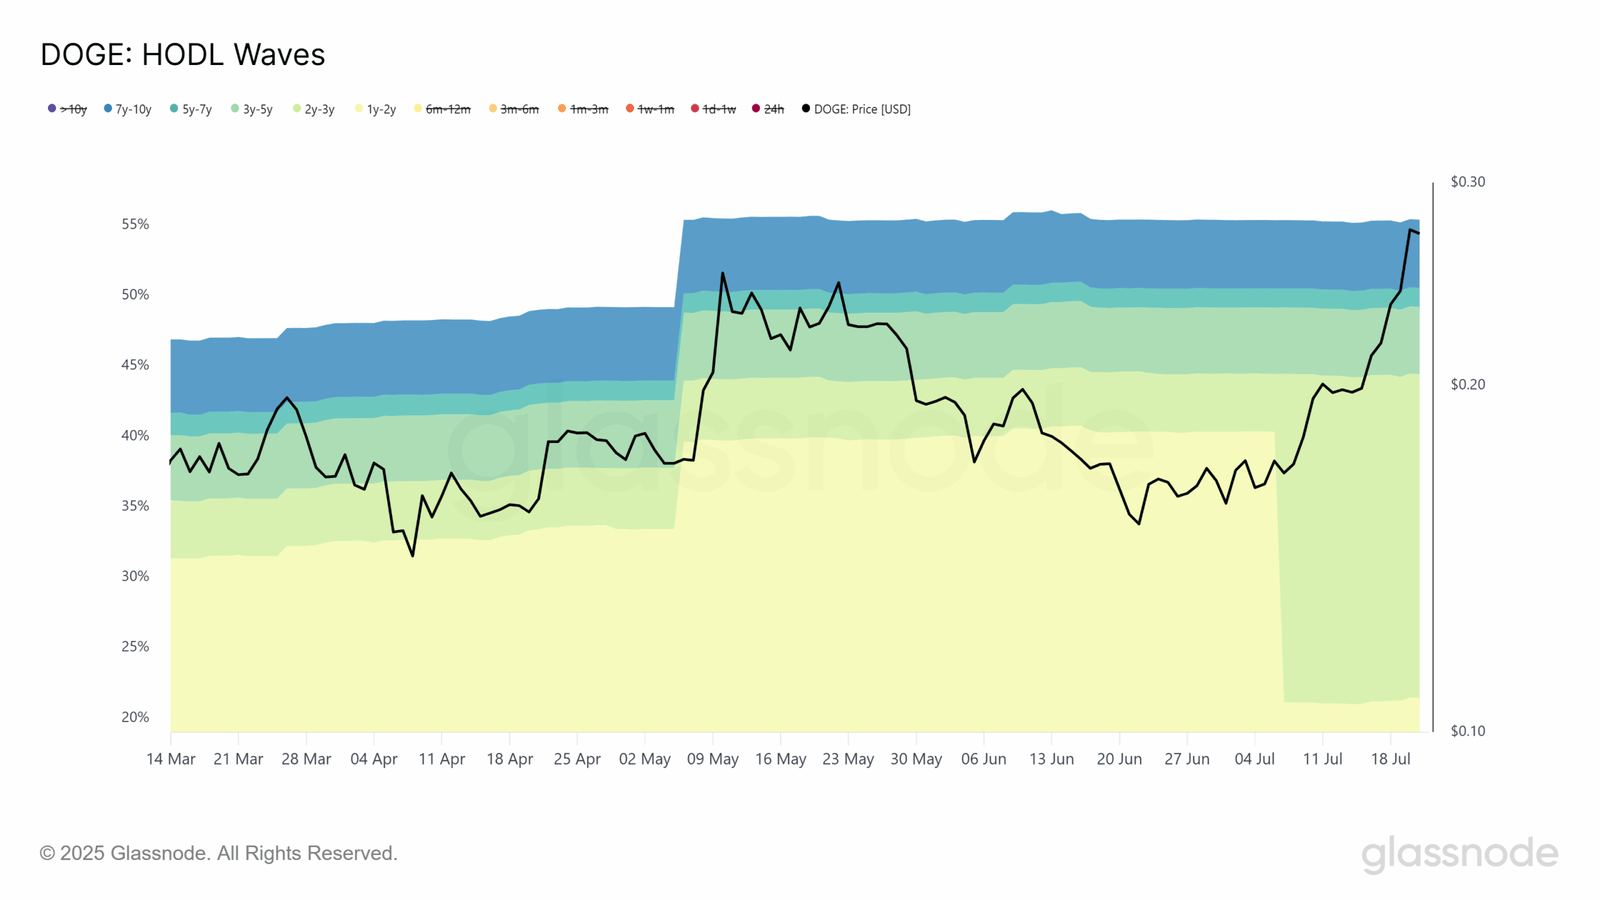
The share of DOGE held for over six months is approaching 55%, reflecting growing mid-term conviction even as older holding bands remained largely unchanged.
But whale supply tells a different story. Glassnode data showed a steady drop in the number of DOGE held by wallets in the 10,000 to 100,000 range—traditionally considered mid-sized whales.
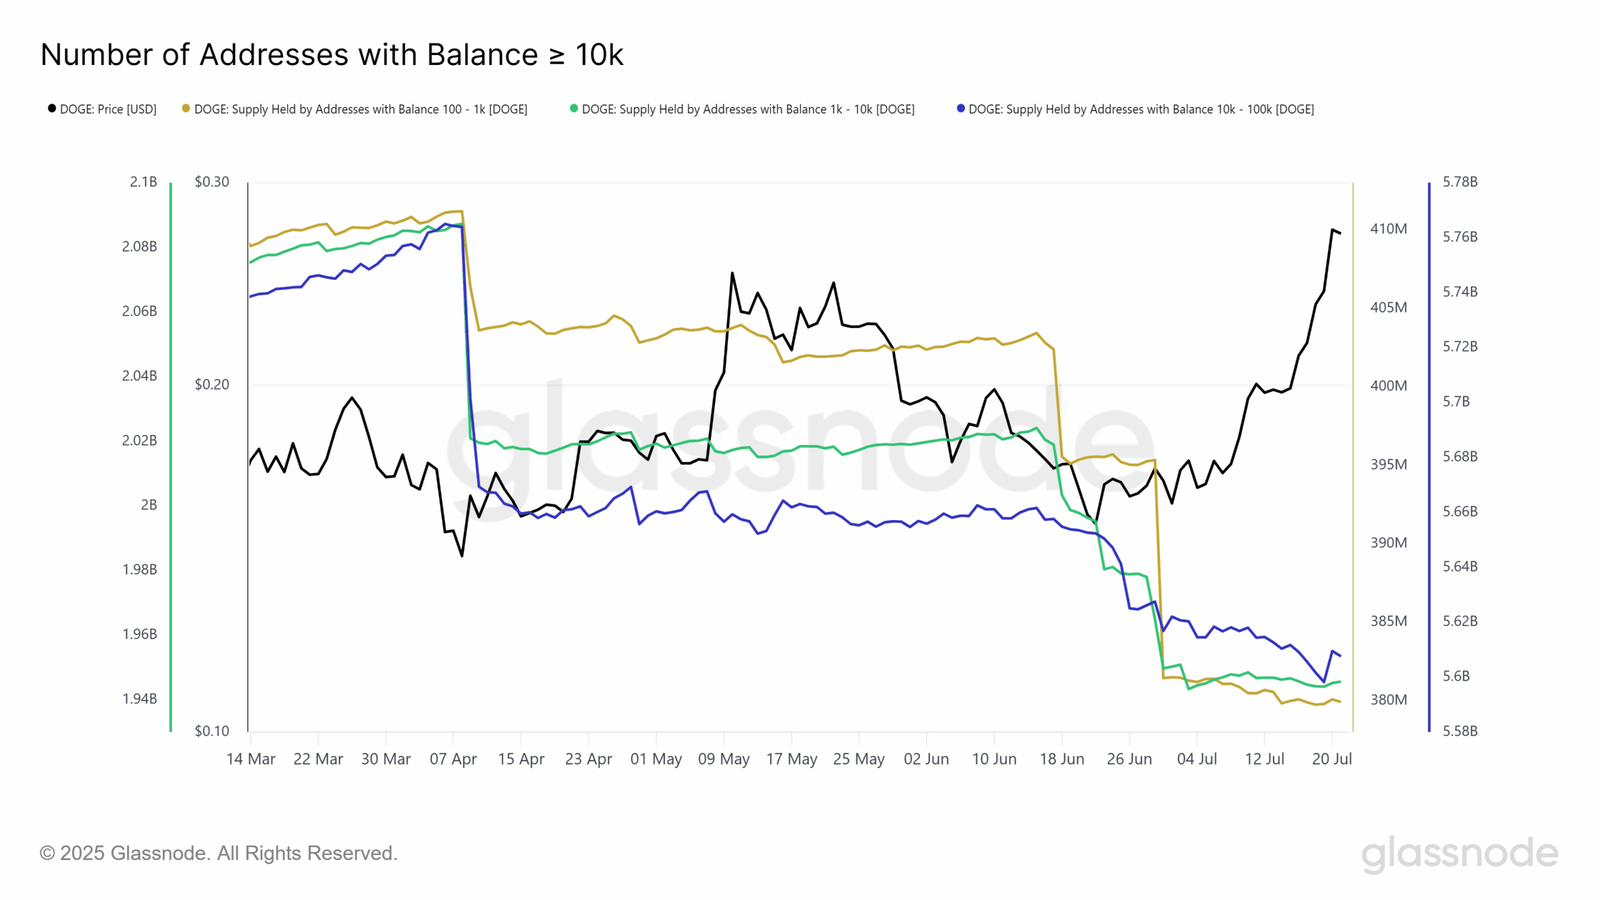
Supply held by these addresses has dropped below 5.6 billion DOGE, reaching the lowest level in over six months. At the same time, smaller holders (100–10,000 DOGE) also trimmed exposure. These categories combined held over 6.1 billion DOGE in early April but now control under 5.9 billion.
This redistribution suggests that recent upside was not led by heavy whale accumulation. Instead, it was likely driven by retail momentum and a reduction in short-term speculative activity. The shrinking supply among active wallets points to decreased liquidity on exchanges, which often leads to sharp price reactions—up and down.
