
Investors are offloading large amounts of XRP, showing weakening confidence in the token’s short-term outlook. In the past week alone, exchange wallets received nearly 450 million XRP—worth over $2.81 billion. This sharp increase in supply suggests many holders are preparing to sell, a signal often tied to bearish market sentiment.
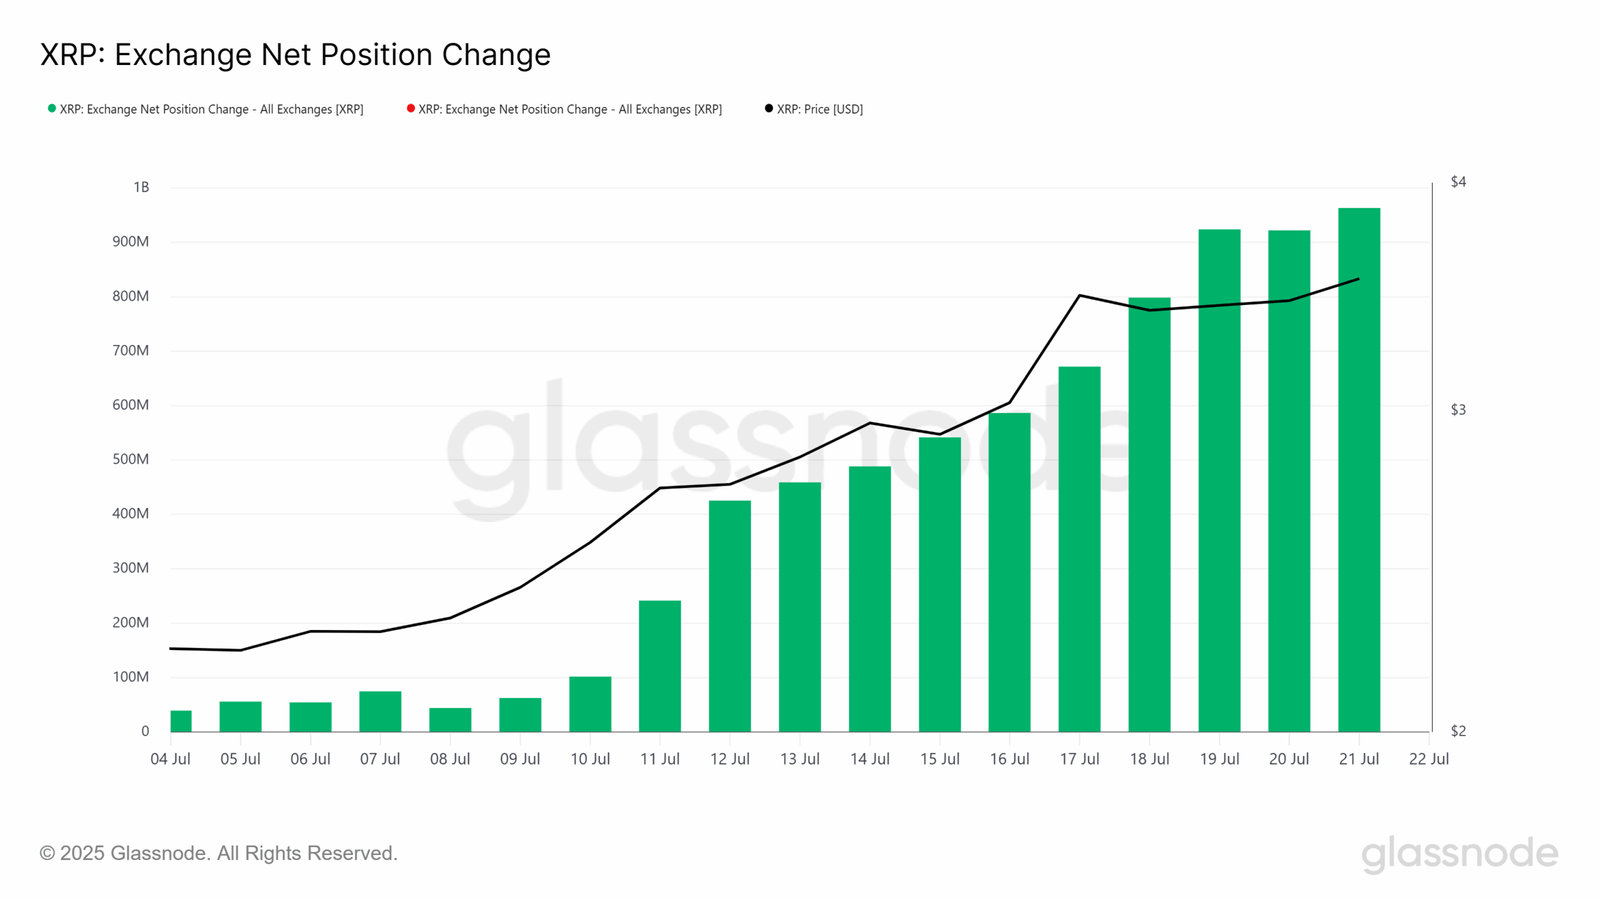
The surge in profit-taking points to rising fears that XRP may have already hit a short-term peak. As more investors rush to lock in gains, selling pressure continues to grow. If this trend persists, XRP could drop below key support levels, making a recovery harder.
On-chain data confirms the growing bearish mood. Glassnode’s Liveliness metric, which tracks long-term holder (LTH) activity, has reached a three-month high. This means that even LTHs—typically known for holding through volatility—are now selling.
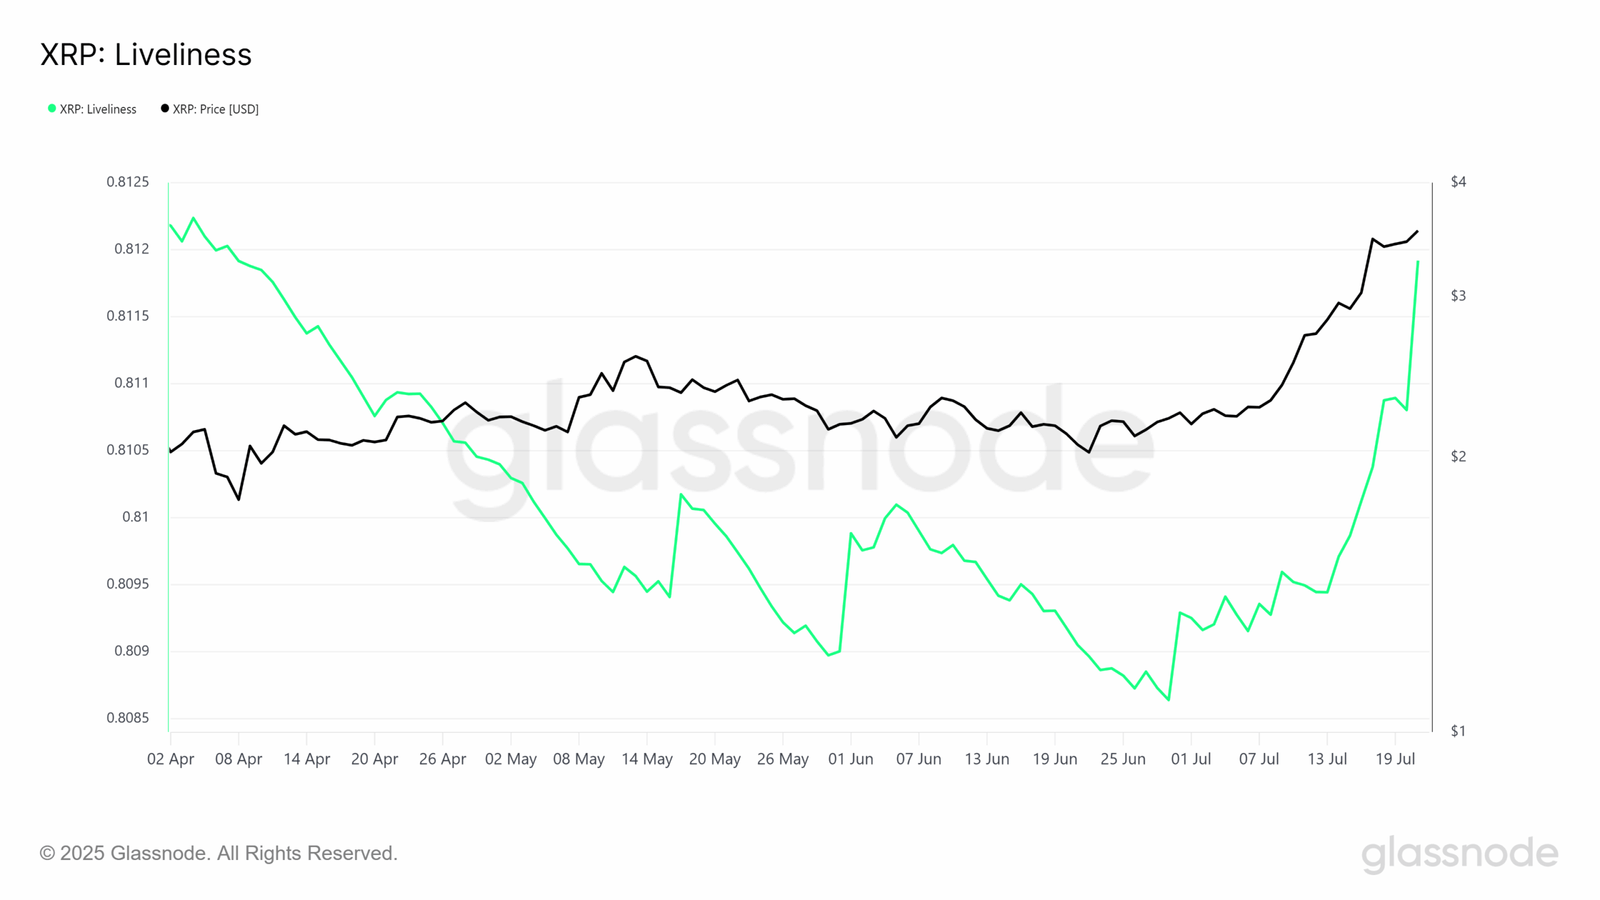
Their exit signals a broader shift. Historically, an increase in Liveliness comes before market corrections. Since LTHs control a large share of XRP’s circulating supply, their actions strongly affect price direction. The rise in Liveliness, paired with the flood of XRP onto exchanges, reflects a changing market sentiment and reduced investor conviction.
XRP Forms Bullish Pennant Pattern on July 23
On July 23, 2025, the XRP /USDT chart on Bitstamp formed a bullish pennant pattern. A bullish pennant is a short-term continuation pattern that appears after a strong price increase, followed by a period of tight consolidation within converging trendlines. It often signals that the price may continue rising once the consolidation ends.

In this case, XRP first surged sharply, then began forming the triangular pennant shape with lower highs and higher lows. This pattern appeared above the 50-period Exponential Moving Average (EMA), which currently sits around $3.32, supporting the bullish structure. The setup remains intact as long as XRP stays above this moving average and within the narrowing trendlines.
If the bullish pennant confirms with a breakout above the upper boundary, XRP could rally by approximately 26 percent from the current price of $3.49. That move would place the next target around $4.64. Volume remains consistent during the consolidation phase, which aligns with classic pennant characteristics. A confirmed breakout with increased volume could trigger strong upward momentum toward that target.
XRP RSI Slips as Momentum Weakens on July 23
On July 23, 2025, the Relative Strength Index (RSI) for XRP to United States Dollar (USD) shows weakening momentum. The RSI value dropped to 52.55, while its 14-period moving average sits higher at 59.56. The RSI measures the speed and change of price movements and typically ranges between 0 and 100. A reading above 70 signals overbought conditions, while values below 30 indicate oversold territory.

Currently, the RSI sits just above the neutral zone, suggesting a potential loss in bullish strength. After peaking above 70 multiple times earlier in July, XRP’s RSI now trends downward, showing that buyers are losing control. The drop below the moving average confirms this softening momentum.
If the RSI continues declining and falls below 50, it could increase the risk of a broader correction. However, the indicator is not yet in bearish territory. The market appears cautious, and unless RSI reclaims its earlier highs, XRP may struggle to sustain further gains without renewed buying pressure.
XRP MACD Turns Bearish on July 23
The Moving Average Convergence Divergence (MACD) for XRP to United States Dollar (USD) shows a shift toward bearish momentum. The MACD line (blue) dropped below the signal line (orange), forming a bearish crossover. This is a common indicator of weakening upward momentum and a possible short-term trend reversal.

The MACD histogram now shows negative values, with a reading of -0.01935, while the MACD and signal lines sit at 0.04637 and 0.06572, respectively. This change signals that the recent bullish trend may be losing strength as selling pressure increases.
Since mid-July, the MACD had shown strong upward movement, supported by green histogram bars and a wide gap between the lines. However, both lines have now turned downward and the histogram has shifted red. Unless the MACD line rebounds above the signal line, the momentum likely favors the sellers. Continued negative divergence could add pressure to XRP’s price action in the coming sessions.
XRP Balance of Power Shows Bearish Bias on July 23
On July 23, 2025, the Balance of Power (BOP) indicator for XRP to United States Dollar (USD) printed a value of -0.39. The Balance of Power measures the strength of buying versus selling pressure. Values above zero suggest buyers are in control, while values below zero point to stronger selling activity.

The latest reading in negative territory indicates that sellers currently dominate the market. The BOP line has been swinging frequently between positive and negative since mid-June, reflecting uncertainty and a lack of clear direction. However, the current dip shows increasing bearish influence as sellers continue to outweigh buyers.
A consistent negative BOP may weaken short-term bullish patterns and prevent momentum from building. Unless the BOP shifts back above zero and holds, XRP could face additional resistance in attempting to move higher.
XRP Stochastic Momentum Index Signals Bearish Crossover on July 23
The Stochastic Momentum Index (SMI) for XRP to United States Dollar (USD) showed a clear bearish signal. The SMI line dropped to -22.31, while the signal line followed at -16.43. The SMI indicator is a refined version of the traditional stochastic oscillator and helps identify short-term momentum shifts.

Currently, both the SMI and signal lines are falling below the zero midpoint, suggesting weakening bullish momentum. The latest crossover—with the SMI line moving under the signal line—confirms a bearish shift. This pattern has repeatedly triggered local dips during the past month, making it relevant for short-term traders.
As the lines slope downward, the bearish crossover reflects sellers gaining control. If both lines continue deeper into negative territory, it would likely reinforce the current downtrend. Momentum remains on the side of the bears unless a reversal brings both lines back above the zero line with upward movement.
