
A chart shared by the Pi Network community shows the $PI token pressing against its 100-day moving average again, following a previous 144% breakout. The price action forms a large descending triangle pattern, with two visible breakout zones marked by high-volume spikes.
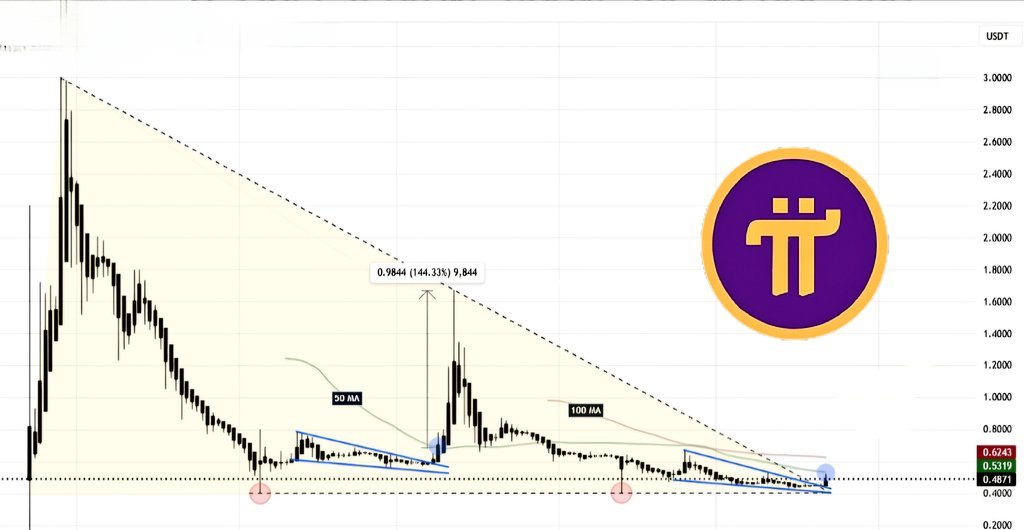
Descending Triangle Breakdown Shows Prior Reversal
The chart shows that Pi Coin formed a large descending triangle over time, with prices consistently falling within the range. The token touched its support level twice before reversing sharply. The previous breakout, marked in the center of the chart, led to a 144.33% increase, moving from around $0.68 to over $1.60.
Now, the chart highlights Pi Coin nearing the upper edge of the triangle once more. It is testing the 100-day moving average (MA), indicated by the curved gray line and blue arrow. If the price breaks this line with volume, it could mirror the previous breakout pattern. The 50 MA was also marked near the first breakout zone, where the token rallied sharply.
The shape of the triangle is narrowing. This pattern suggests decreasing volatility but rising pressure. If the pattern repeats, traders may see another breakout attempt as the price interacts with this upper boundary.
The chart uses clean support and resistance levels, with three current price levels shown: $0.6243, $0.5319, and $0.4871.
Pi Coin RSI Drops Below 40, Signals Growing Bearish Momentum
On July 23, Pi Coin’s 14-day Relative Strength Index (RSI) dropped to 38.64, according to TradingView data. This move places the token in a bearish zone, as the RSI slipped well below the neutral 50 level. RSI measures the speed and change of price movements. It usually ranges between 0 and 100. Values above 70 suggest the asset is overbought, while values below 30 point to oversold conditions.
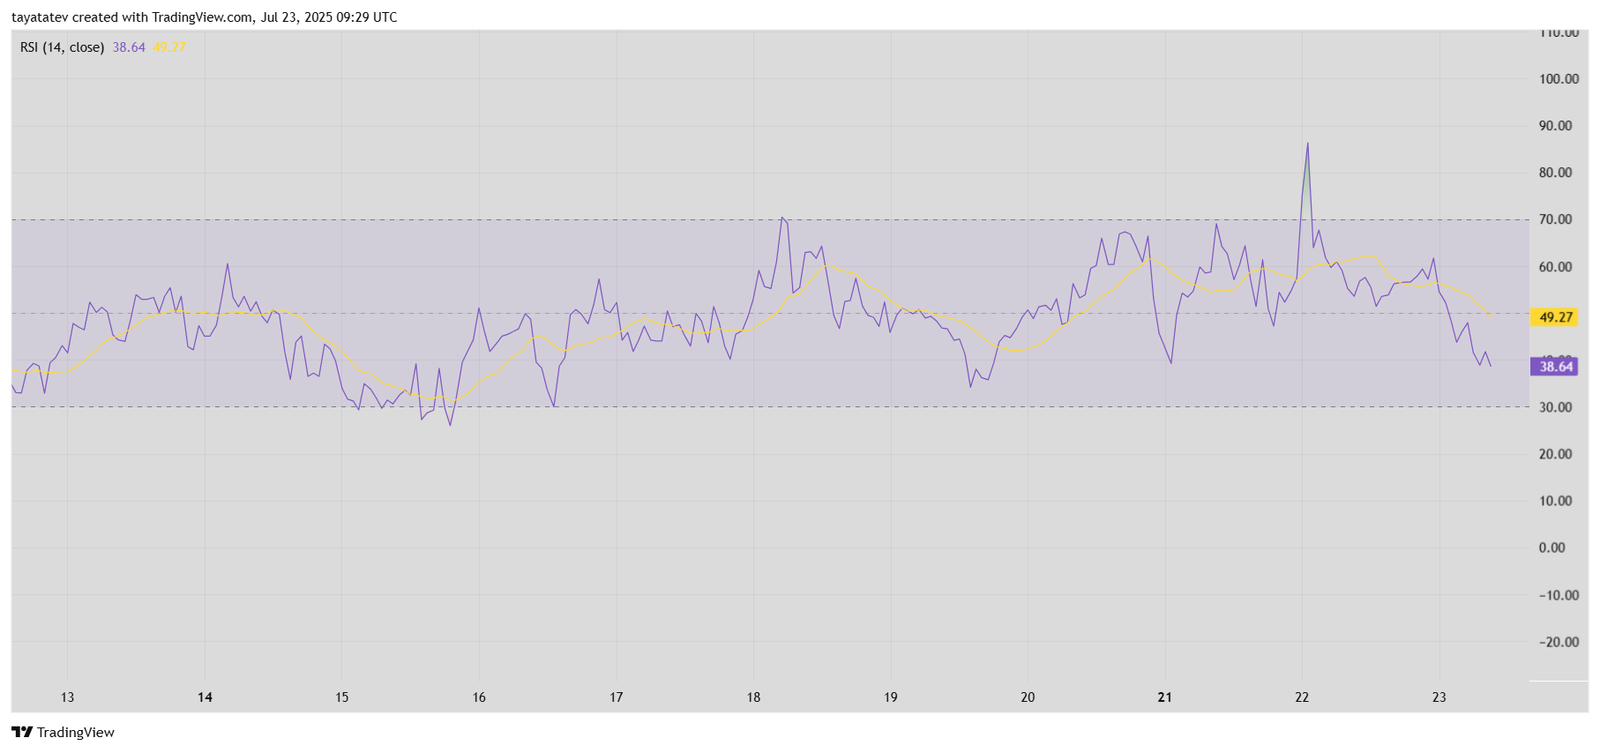
The current level near 38 indicates sellers are gaining strength. After reaching nearly 90 on July 20, the RSI has declined sharply. That earlier spike likely marked a local top, and the downtrend since then shows weakening momentum on the bullish side.
At the same time, the yellow line on the chart, which tracks the RSI’s moving average, now sits at 49.27 and is trending down. The gap between the moving average and the actual RSI value is widening, which confirms that selling pressure continues to dominate.
If the RSI keeps falling and crosses the 30 mark, it would place Pi Coin in oversold territory. That zone often leads to temporary rebounds, but only if buying volume returns. For now, both the declining RSI and the downward-sloping average point to increased bearish sentiment.
