
Ether ETF inflows reached $2.39 billion across the last six trading sessions, according to Farside Investors. In the same period, Bitcoin ETF products recorded $827 million in net inflows.
Each day, Ether ETF inflows exceeded Bitcoin ETF inflows, marking a rare six-day lead. This change highlights rising institutional activity around Ethereum-based funds.
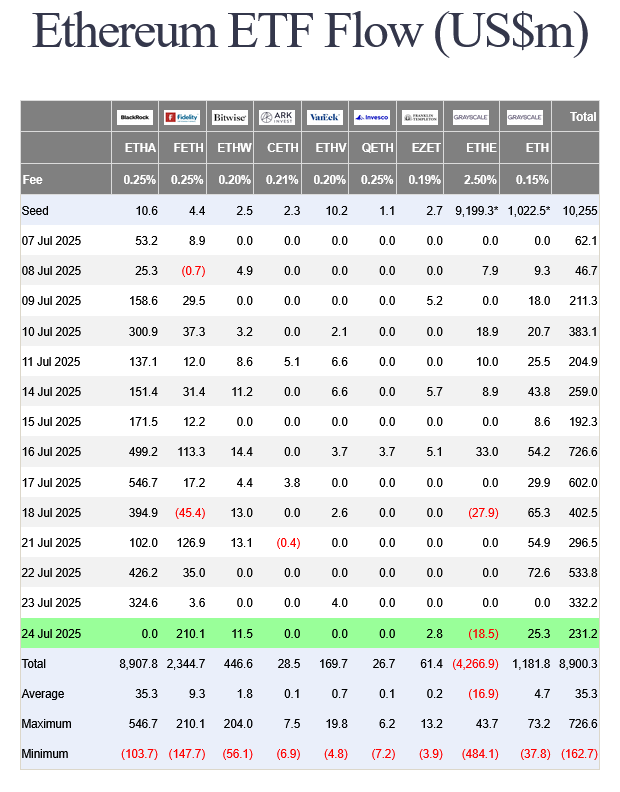
Farside’s report confirmed the day-by-day performance, showing consistent preference for ETH ETF products throughout the week.
BlackRock ETHA Dominates Ether ETF Inflows With $1.79 Billion
BlackRock’s ETH ETF, listed under the ticker ETHA, recorded $1.79 billion in net inflows in just six days. This was nearly 75% of the total Ether ETF inflows during the period.
ETHA recently crossed $10 billion in assets under management. It reached the milestone in 251 trading days. This makes it the third-fastest ETF ever to hit that benchmark.
Meanwhile, the Fidelity Ethereum Fund (FETH) posted its highest single-day inflow on Thursday. The fund brought in $210 million that day, exceeding its December 10, 2024 record of $202 million.
BitMine Adds $2 Billion to ETH Holdings, Boosting Institutional Share
Institutional demand for Ethereum has increased recently. BitMine Immersion Technologies purchased $2 billion worth of ETH over the past 16 days. This acquisition made BitMine the top corporate holder of Ethereum.
Strategic Ether Reserves reported that corporate treasuries now hold 2.31 million ETH. This represents 1.91% of Ethereum’s current circulating supply.
Other corporate holders include SharpLink Gaming, which also made significant ETH purchases in recent months. These holdings are tracked through public treasury filings and reserve data.
Bitcoin ETFs See Outflows After 12-Day Inflow Streak Ends
Bitcoin ETF products broke their 12-day inflow streak on Monday. That day, BTC ETFs recorded a net outflow of $131 million, according to Farside.
The previous 12 trading days brought $6.6 billion in net inflows to Bitcoin ETFs. The streak had marked one of the longest inflow runs for BTC funds in 2025.
Swissblock Research commented on the development, stating,
“ETH is rotating into leadership as the next leg of the cycle unfolds.”
The research noted the shift without offering projections.
Bitcoin Price Chart Forms Bullish Falling Wedge on July 25
The chart, created on July 25, 2025, shows BitcoinBTC/ USDT trading against the U.S. Dollar (USD) on the Bitstamp exchange. The 4-hour chart highlights that Bitcoin formed a bullish falling wedge pattern after its sharp rally earlier in July. A falling wedge is a chart pattern that often signals a possible trend reversal, where prices may move higher if confirmed.
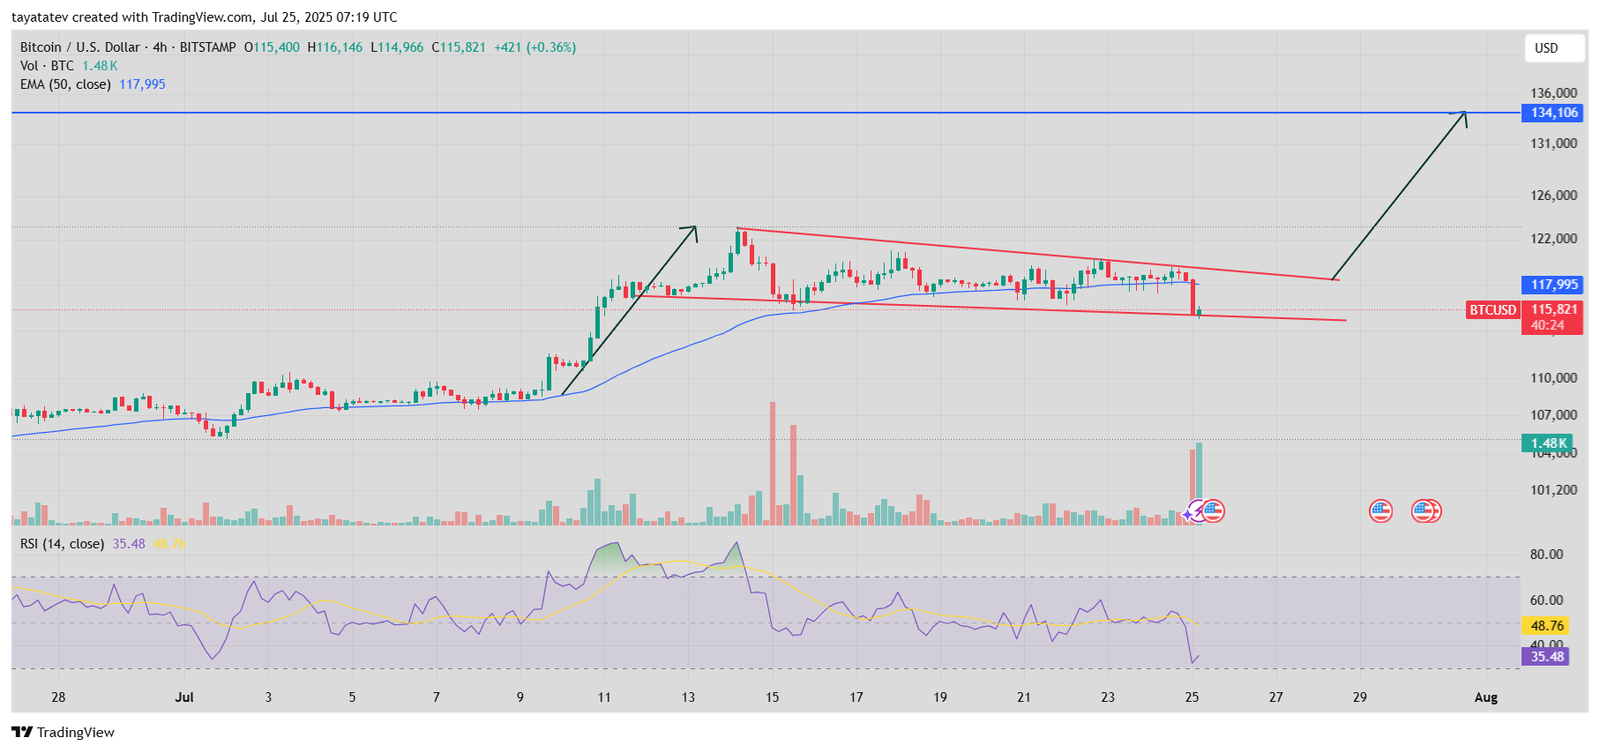
Bitcoin’s price reached $115,821 at the time of the snapshot, while the 50-period exponential moving average stood at $117,995. The falling wedge pattern formed with two downward-sloping trendlines, both gradually narrowing toward each other. At the same time, volume remained steady, then spiked sharply on the final candle, indicating an early breakout attempt.
The chart also shows a potential target at $134,106. This implies a possible 16 percent increase from the current level if the breakout holds. Traders use this type of pattern to identify breakout points above the upper trendline. When confirmed, it often signals a continuation of the previous bullish move.
The Relative Strength Index (RSI), currently at 35.48, shows Bitcoin trading in the lower range, near oversold levels. The previous price action saw Bitcoin rise strongly from below $105,000 to a recent peak near $123,000 before entering a sideways decline. That period of decline created the wedge structure now visible on the chart.
The price has touched the lower trendline, just below the 50-period exponential moving average, and bounced slightly. If volume continues rising and price closes above the wedge, the projected breakout target remains $134,106. However, the breakout must hold with increasing buying pressure to maintain momentum.
As of now, the wedge structure, bounce, and sudden spike in volume all align with the early signals of confirmation. The setup points to a possible shift in market direction from consolidation to upward movement, pending further confirmation through price action.
Ethereum Forms Bullish Descending Triangle on July 25 Chart
Meanwhile, the Ethereum ETH/ USDT chart from July 25, 2025, shows a bullish descending triangle forming on the 4-hour timeframe. A descending triangle is a pattern where the price moves between a flat support level and lower highs, signaling potential upward movement once it breaks out.
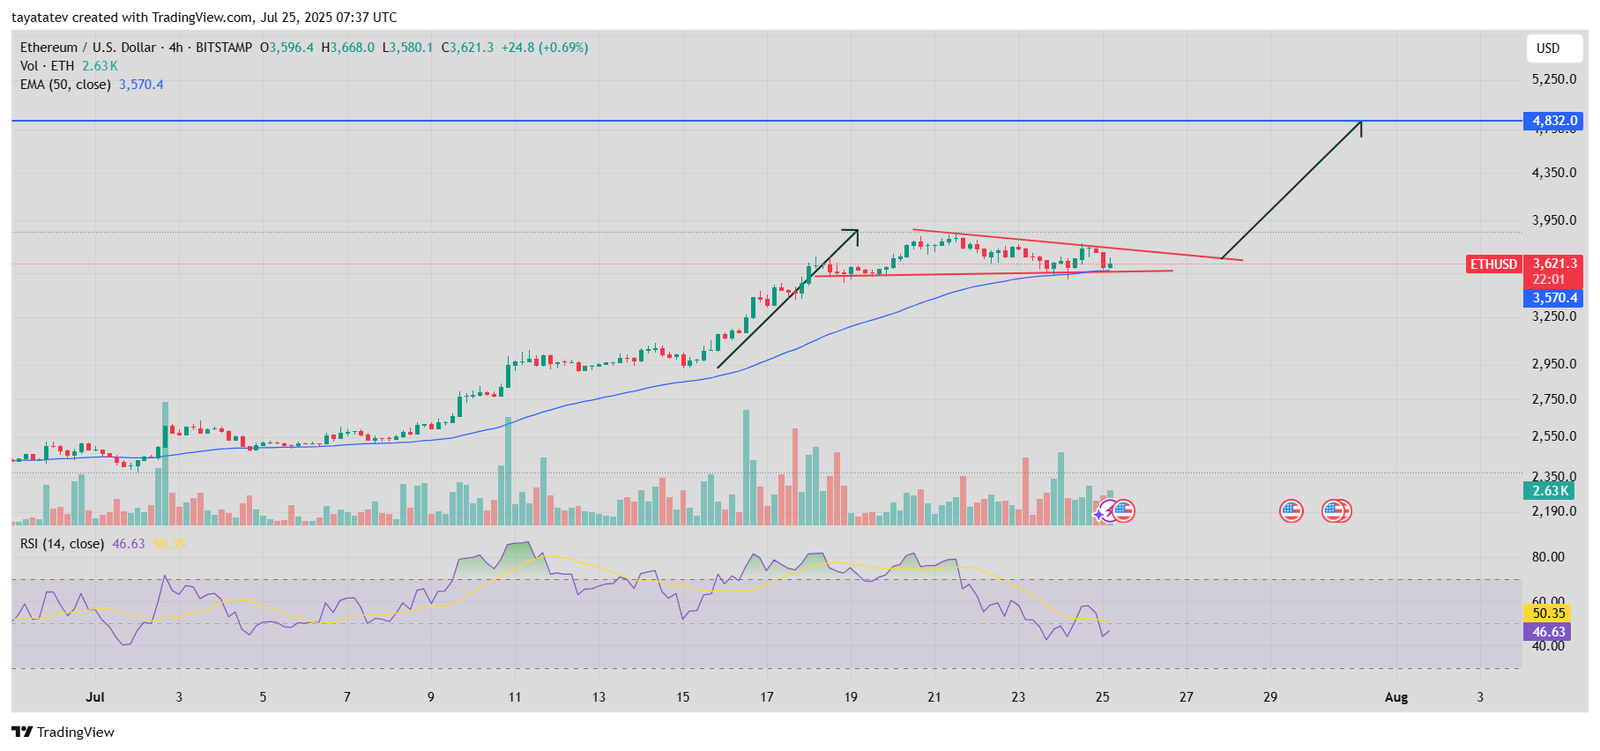
Ethereum is currently trading at $3,621 while the 50-period exponential moving average stands at $3,570. The pattern formed after ETH rallied earlier this month from around $2,600 to nearly $3,800. After the sharp move, the price entered a narrowing consolidation, with lower highs and consistent support around the $3,570 level.
If the descending triangle confirms a breakout above the upper resistance trendline, the projected move targets $4,832. That would represent a 33 percent increase from the current price of $3,621. The breakout level and target are marked clearly on the chart, along with increased activity on recent candles.
The trading volume, currently at 2.63 thousand ETH, shows several spikes during price consolidation. The pattern has compressed near the 50-period exponential moving average, which often acts as dynamic support during consolidations. The upward breakout arrow drawn on the chart shows a possible path if buying pressure increases.
The Relative Strength Index (RSI) sits at 46.63, just under its 14-period moving average of 50.35. This RSI level suggests the price is not yet overbought, leaving room for further upside if the breakout confirms.
As price remains above the support and continues to hold near the triangle’s end, a breakout could follow with strong volume. The chart shows ETH holding above the moving average despite downward pressure, supporting the triangle’s bullish setup. If confirmed, Ethereum could reach the $4,832 target in the short term.
The structure, price compression, and volume suggest that Ethereum is preparing for a potential breakout.
