
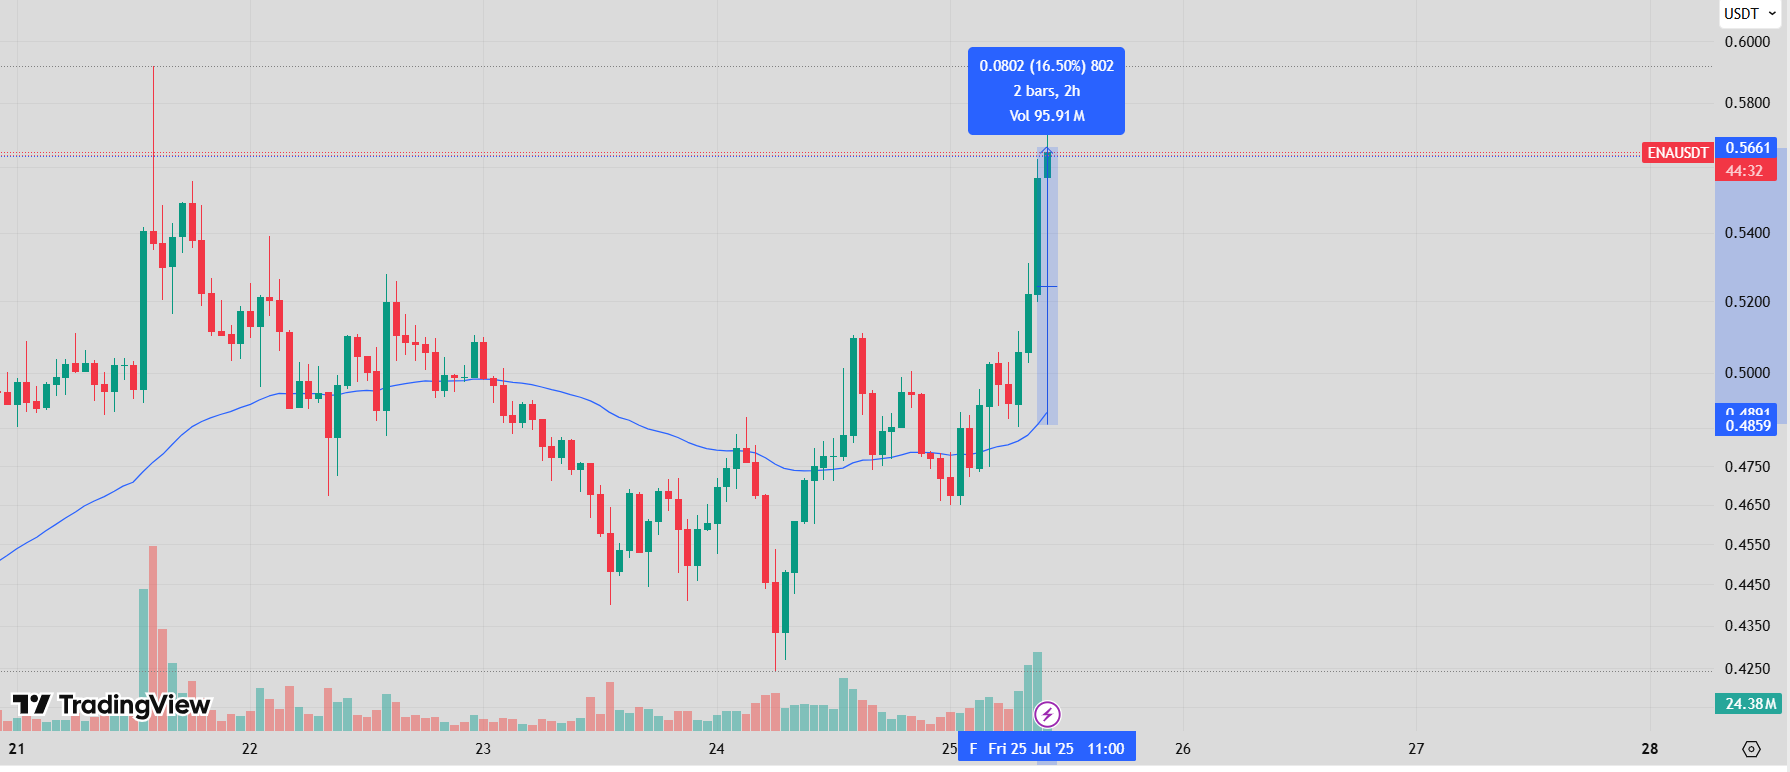
The ENAUSDT trading pair surged 16.5% within just two hours on July 25, reaching $0.5661, according to TradingView data. The rapid climb added $0.0802 to its price, marking one of the strongest short-term moves for the token in recent days.
ENA Breaks Out After Sideways Action
Before the breakout, ENA traded mostly sideways between $0.43 and $0.49. A long consolidation phase lasted from July 21 to the early hours of July 25, showing low volatility and reduced trading volume. The price hovered near the 50-period moving average, showing indecision.
The breakout began near 11:00 AM UTC on July 25. In just two hourly candles, the token gained over 16%, backed by 95.91 million in volume. This volume spike sharply contrasts the lower levels seen earlier this week, with the final bar showing 24.38 million in volume.
The move occurred after the price reclaimed the moving average around $0.48. The sharp green candles confirmed bullish momentum and a break from the previous pattern.
Resistance and Next Levels
The price is now testing the $0.5661 level. If momentum holds, ENA could attempt to break past $0.58, a level last approached earlier in the week. If the rally fails, immediate support lies near $0.50 and then $0.4859, where the moving average is currently positioned.
So far, the rally appears technically driven, with no clear external catalyst visible in the chart. The strong volume suggests renewed interest, possibly from institutional or whale buyers. Further confirmation will depend on whether ENA can hold above the breakout level in the coming hours.
Ethena RSI Surges to 73.88, Signals Overbought Conditions
The Relative Strength Index (RSI) for ENA/USDT rose sharply to 73.88 on July 25, entering overbought territory. This marks a significant shift from the previous sessions, where RSI mostly hovered below 50, showing weak momentum.
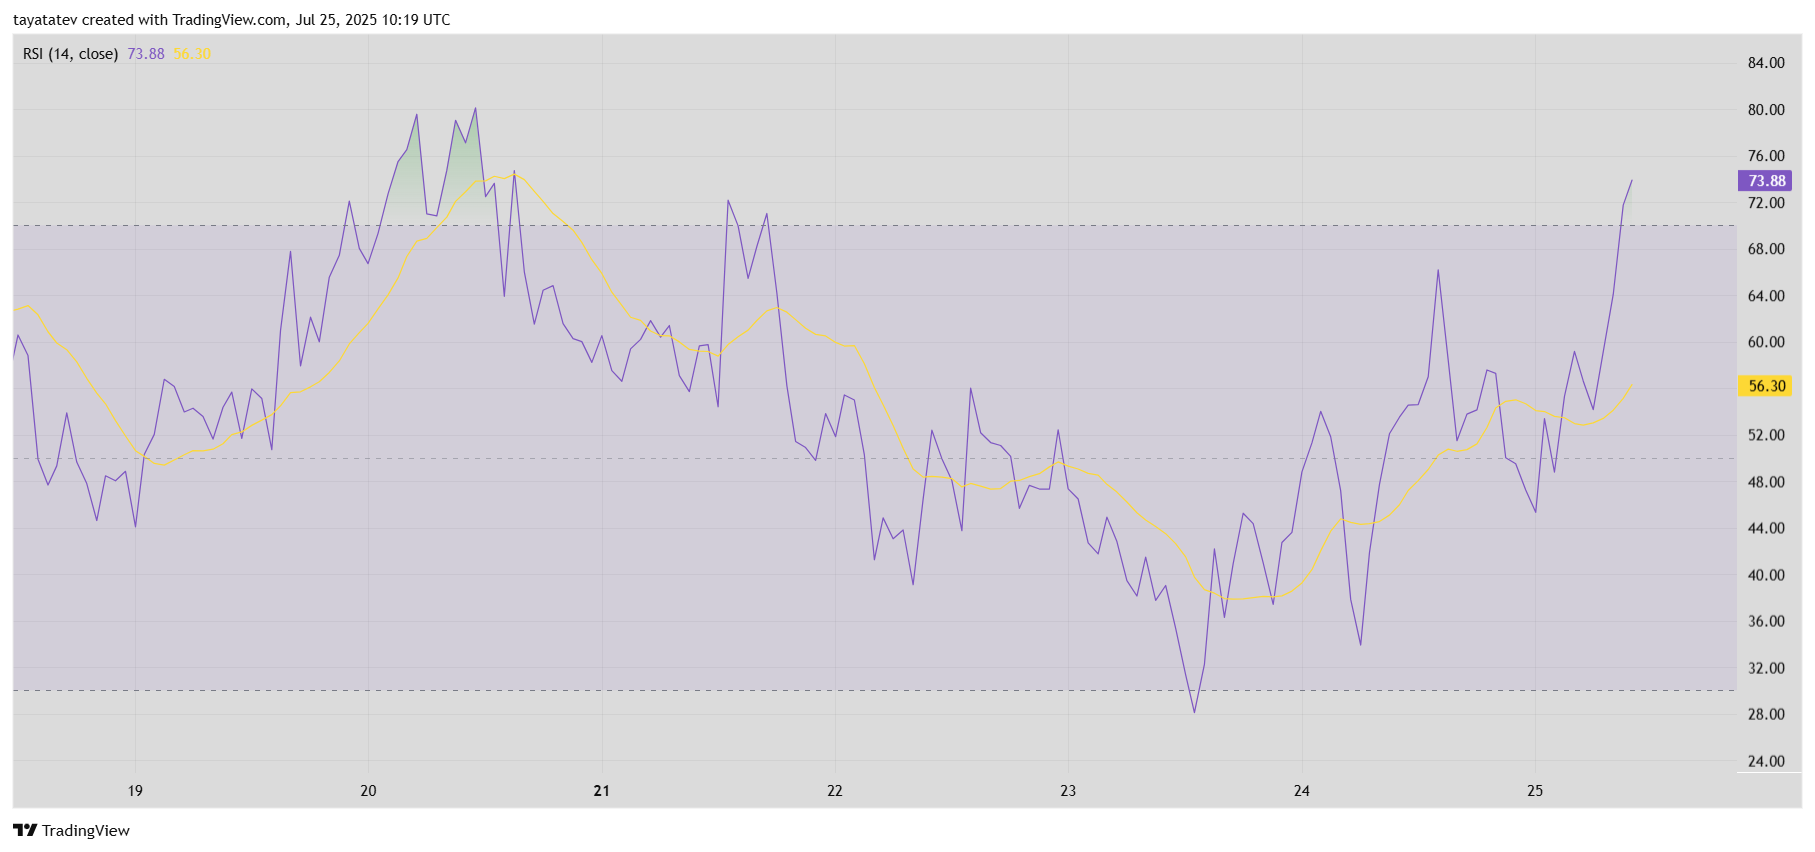
The current RSI reading suggests strong bullish pressure. The indicator also crossed far above its signal line at 56.30, confirming acceleration in upward momentum. Such a divergence typically reflects aggressive buying activity.
An RSI above 70 often signals short-term overextension. While it confirms strength, it also warns of a possible cooldown or consolidation ahead unless buying pressure continues.
