
Ethereum (ETH) surged 50% in two weeks, climbing to $3,744 and pulling investor attention back after a slow period. However, ETH still trades 23% below its all-time high from November 2021. At $3,730, it remains well below its historical peak, but analysts believe a much bigger move could follow.
ETH Still Undervalued, Data Shows
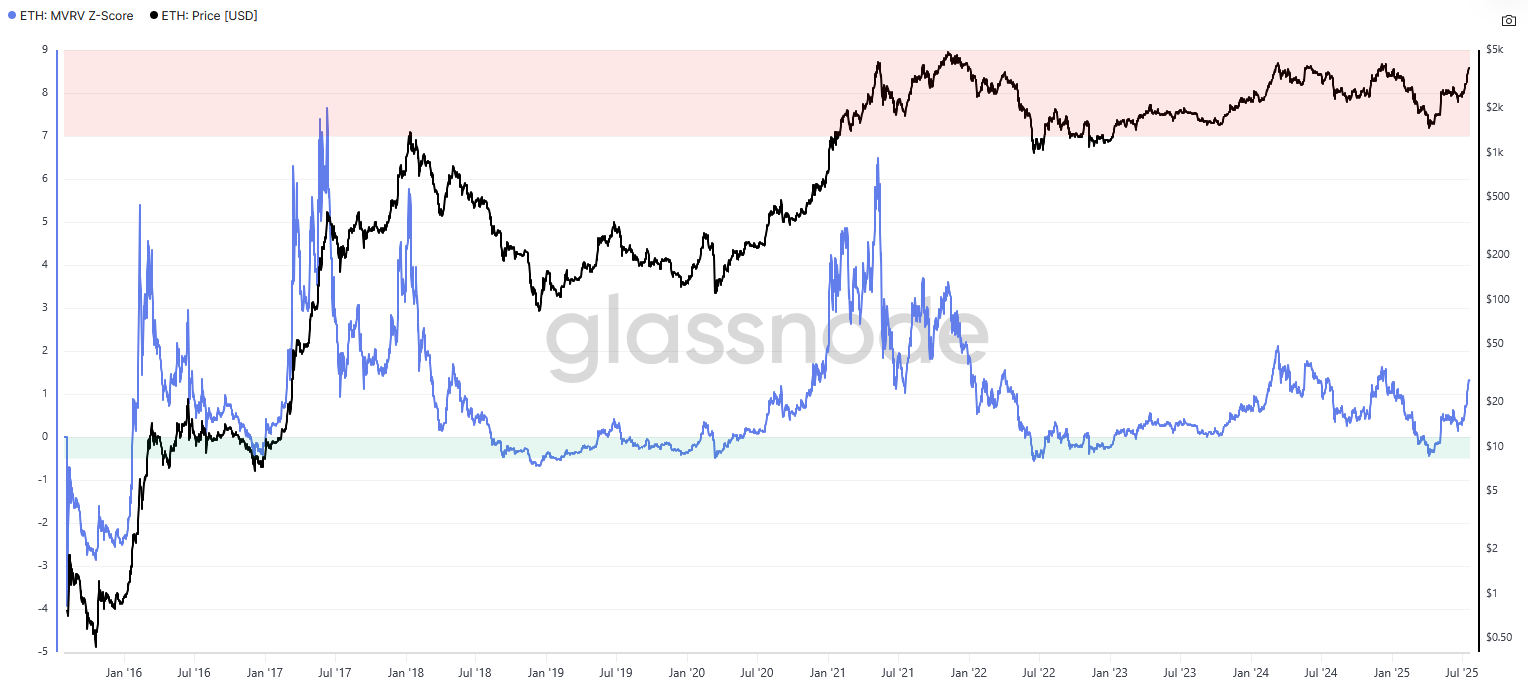
Despite the sharp price increase, ETH appears undervalued across multiple metrics. According to Glassnode, Ethereum’s MVRV Z-score—a key indicator comparing market cap to realized cap—remains far from past cycle peaks. While the Z-score shows ETH has exited the bearish zone, it still sits below euphoric levels usually seen during major tops.
Compared to Bitcoin, ETH has lagged significantly. Bitcoin gained 74% over the past year, while ETH dropped 28%. This widened the performance gap and pushed BTC dominance to historic levels. Analysts at Bitcoin Vector said ETH now looks “under-owned, undervalued, and in catch-up mode,” signaling a potential market rotation toward Ethereum.
A major short-term target is the $4,000 level. This acts as both a psychological and technical resistance. If ETH breaks through it, price momentum could accelerate.
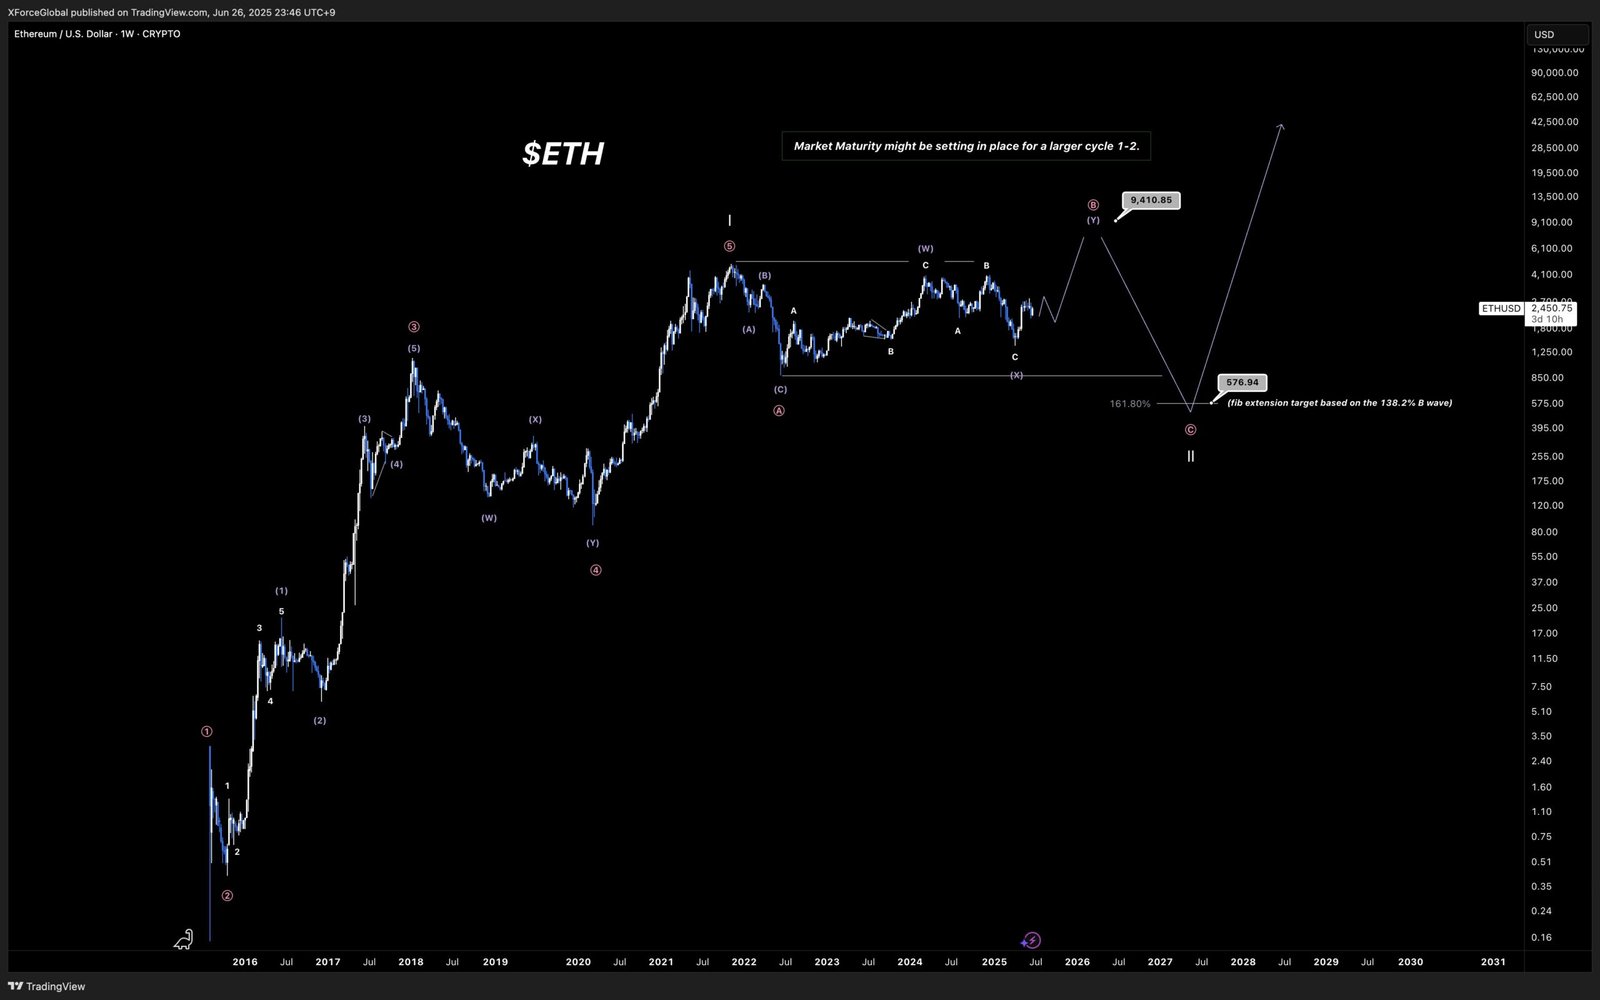
XForceGlobal analysts pointed to Elliott Wave theory, which tracks five-wave price cycles driven by investor psychology. ETH, they said, is likely in the third impulsive wave of this pattern. If the forecast holds, ETH could climb as high as $9,000 by early 2026, assuming supportive macro conditions.
Onchain Data Reveals Tight Supply, Growing Demand
Onchain metrics also point to long-term bullish pressure. Over 34 million ETH is currently staked, locking away 28% of the 120.7 million total supply. This reduces circulating supply and reflects strong investor confidence.
At the same time, exchange balances have dropped to just 16.2 million ETH—the lowest level since 2016. With less ETH available for sale, price movements face reduced selling pressure.
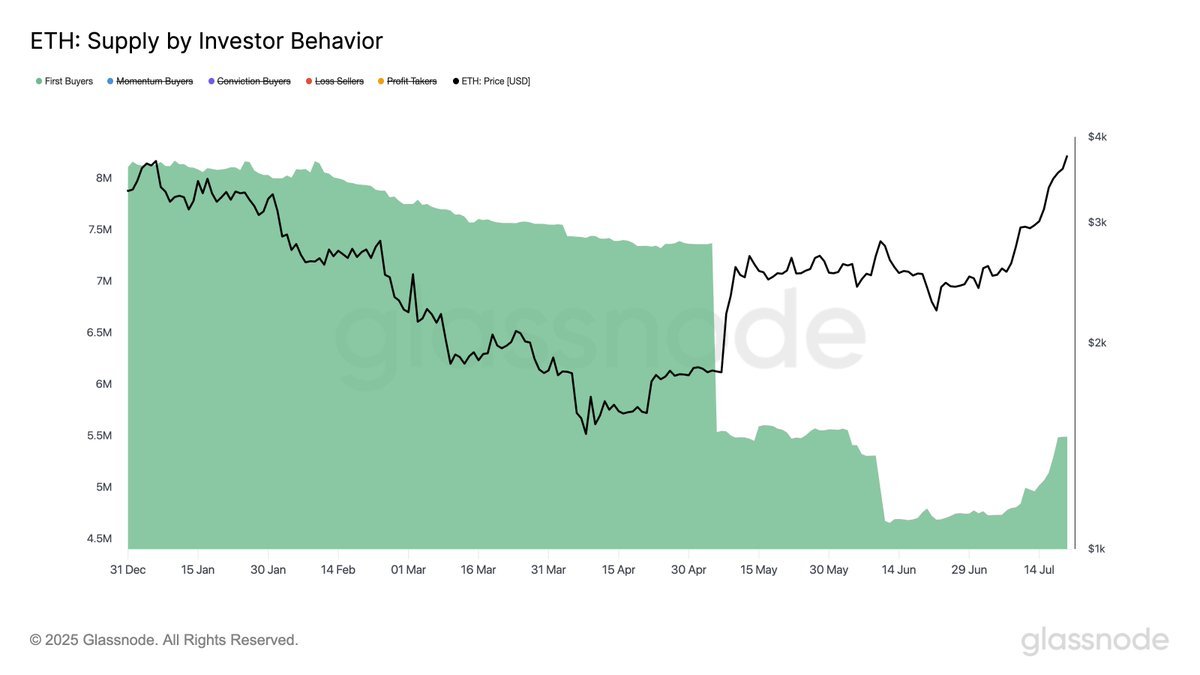
Meanwhile, demand appears to be rising. Since early July, Glassnode reported a 16% jump in ETH held by first-time buyers. This signals renewed interest from new market participants. Glassnode analysts noted this was the first meaningful sign of a market trend reversal.
Spot Ether ETFs also reflect growing demand. Inflows surpassed $4 billion over the past two weeks, further reducing available supply.
Currently, 94.4% of ETH supply sits in profit. Still, investor sentiment hasn’t reached euphoric levels. Glassnode’s Net Unrealized Profit/Loss (NUPL) indicator shows ETH at 0.47—within the “Optimism/Anxiety” zone. In comparison, Bitcoin and Ripple both read higher at 0.57 and 0.62, respectively, falling into “Belief/Denial” territory.
Ethereum Usage Rises As Network Scales
Ethereum’s value also depends on real-world use, not just speculation—and that usage continues to grow.
Average transaction fees dropped to 0.0004 ETH, near historic lows. This drop doesn’t mean Ethereum is idle. Instead, it reflects better efficiency, with more activity now handled by layer 2 networks.
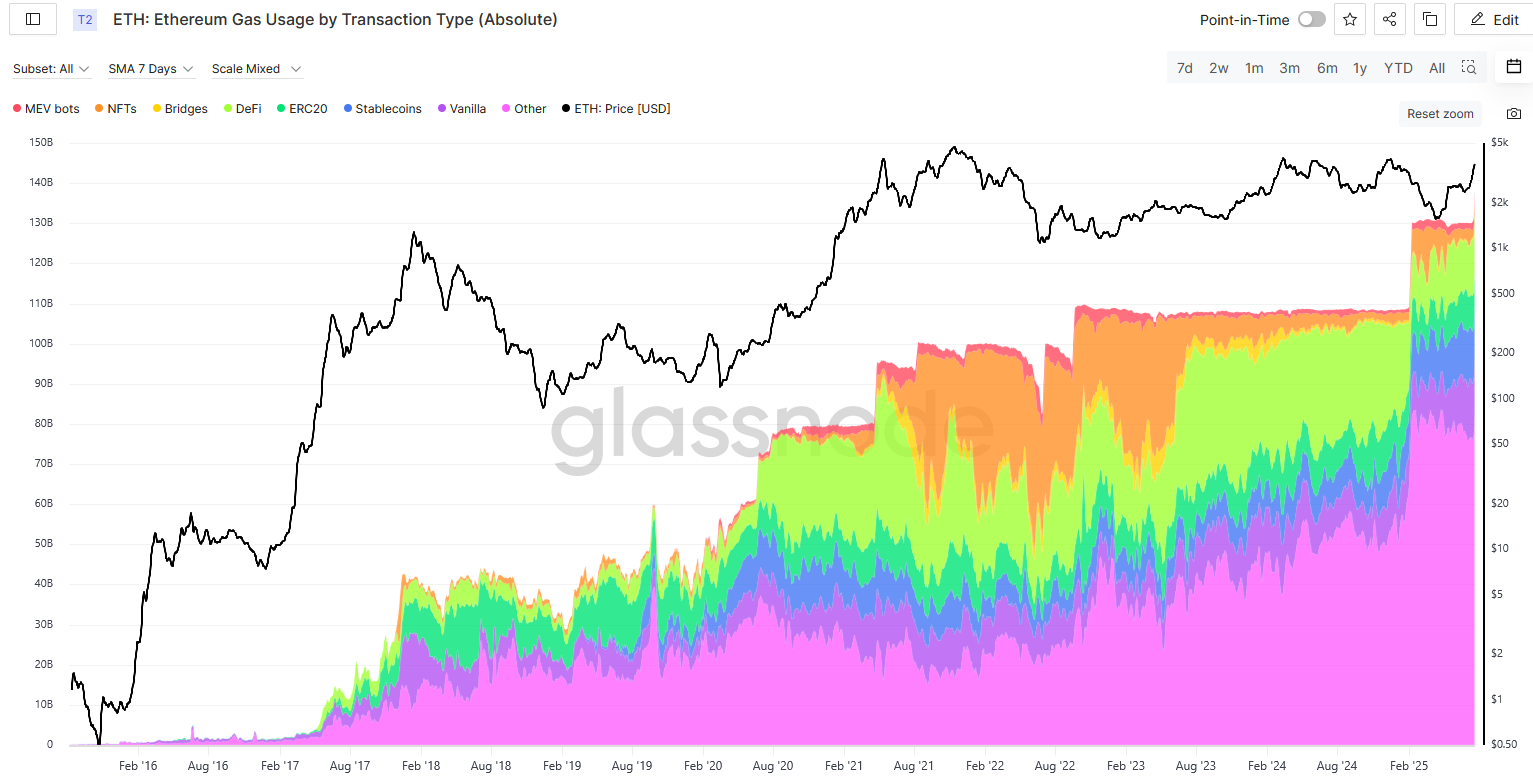
Gas fees, which measure computational use, show a clearer picture. Ethereum block gas limits have increased repeatedly—most recently in July 2025, with earlier hikes in February 2025, September 2022, May 2021, and June 2020. Each time, blocks filled immediately, suggesting strong underlying demand.
That pattern continued this week. After the latest block size increase, blocks filled again, confirming that Ethereum has operated near full capacity and that demand was waiting for room to grow.
Transaction Types Shift From NFTs to Infrastructure
The nature of Ethereum activity has changed. NFTs, which once dominated in 2021, now make up a small portion of traffic. DeFi has also slowed. What’s rising instead is activity from infrastructure DApps, proof publishing, automation tools, and modular applications.
Stablecoin transfers and simple ETH movements between addresses are also increasing. These trends show Ethereum’s growing role in settlement and trading, which typically accompanies bull market phases.
Ethereum continues to expand its transaction capacity while demand keeps pace. Combined with locked supply, new demand, and low investor euphoria, the data suggests ETH’s rally may not be over.
ETH Forms Bullish Pattern as Breakout Gains Momentum
The Ethereum to U.S. Dollar (ETH/USD) chart, created on July 26, 2025, shows a bullish descending triangle pattern on the 4-hour timeframe. This technical pattern forms when the price makes lower highs but holds a strong horizontal support line. It typically signals that buyers are building strength and a breakout to the upside may follow.
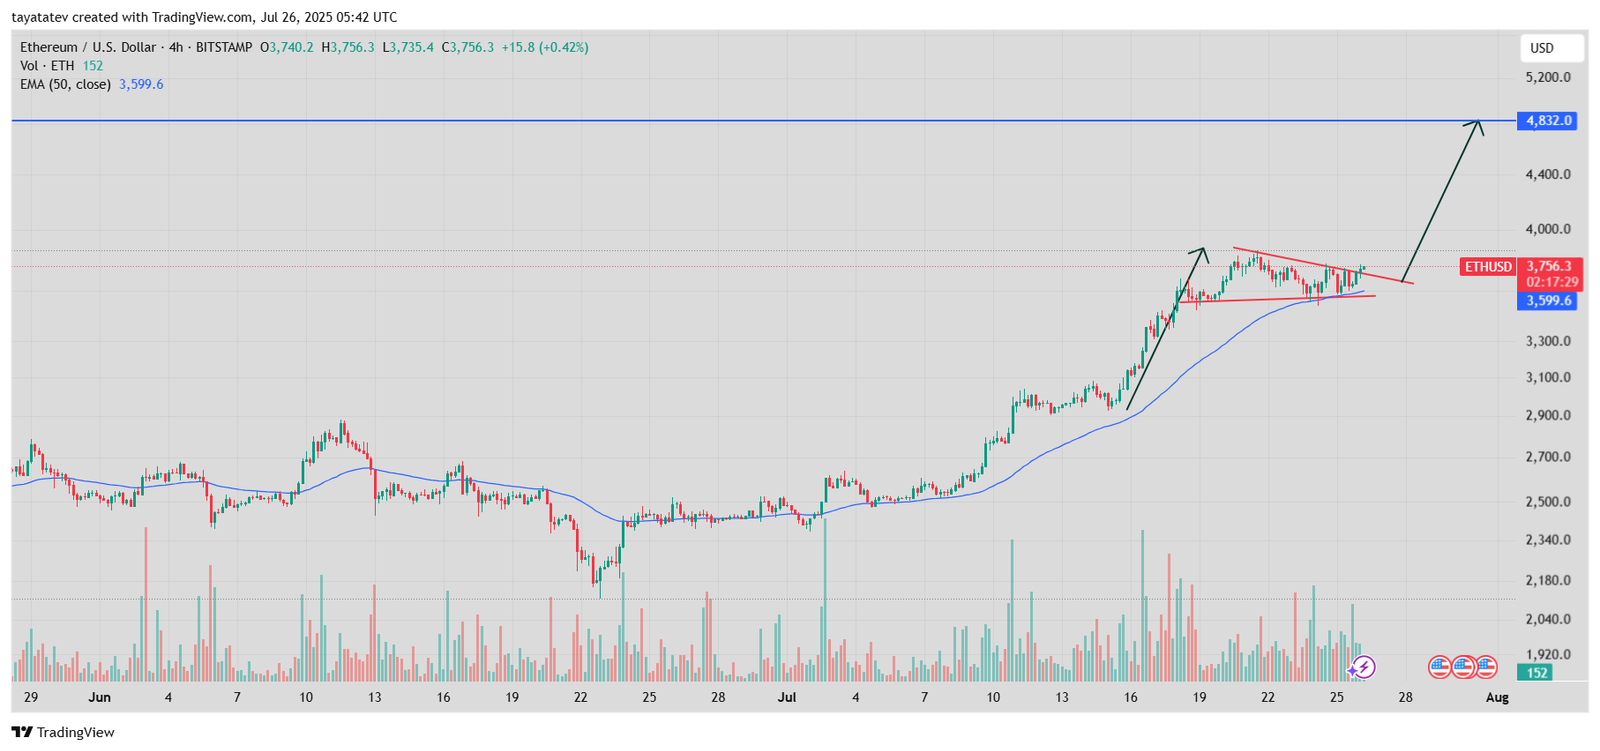
Ethereum broke out of the descending triangle and is already moving upward. The price reached $3,756 at the time of the chart, confirming a breakout above the resistance line. The pattern suggests further upside, and based on the triangle’s height, the projected move targets approximately 28% above the breakout point. If ETH continues this trajectory, the price could rise to around $4,832. This level aligns with the next marked resistance on the chart. The presence of strong volume and continued support from the 50-period exponential moving average (EMA) near $3,599 supports the bullish outlook.
ETH RSI Rebounds Toward Bullish Zone
This Relative Strength Index (RSI) chart for Ethereum (ETH), created on July 26, 2025, shows a short-term rebound from neutral territory. The RSI (14) line currently reads 51.82, while its moving average holds at 56.60. Both values remain inside the 30–70 range, which signals that ETH is neither overbought nor oversold.
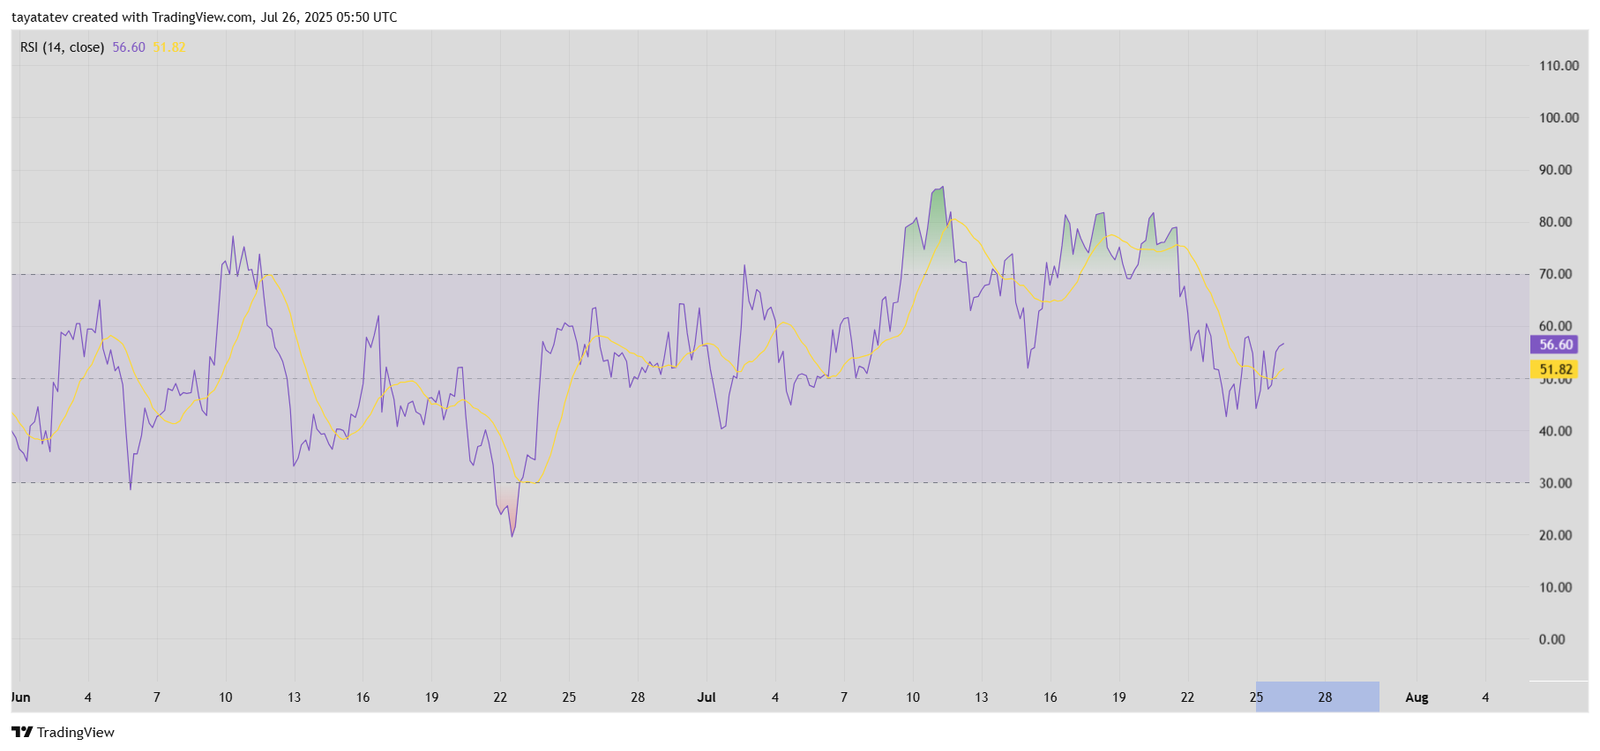
Throughout July, the RSI mostly stayed above 50, reflecting moderate buying pressure. However, it dipped below 40 around July 22, indicating short-term weakness. Now, the recent uptick above 50 shows ETH is regaining momentum. The yellow moving average line also started to flatten after declining, which supports a potential upward move if momentum continues.
In summary, the RSI pattern suggests Ethereum is recovering from a minor pullback and could build strength if buyers stay active above the 50 level. A sustained push toward 60–70 would confirm rising bullish momentum.
