
The Pepe Coin PEPE / USDT chart, created on July 30, 2025, shows a bullish pennant pattern. A bullish pennant is a continuation pattern that forms after a strong upward price movement, followed by consolidation within converging trendlines, usually signaling the potential for further gains if confirmed.
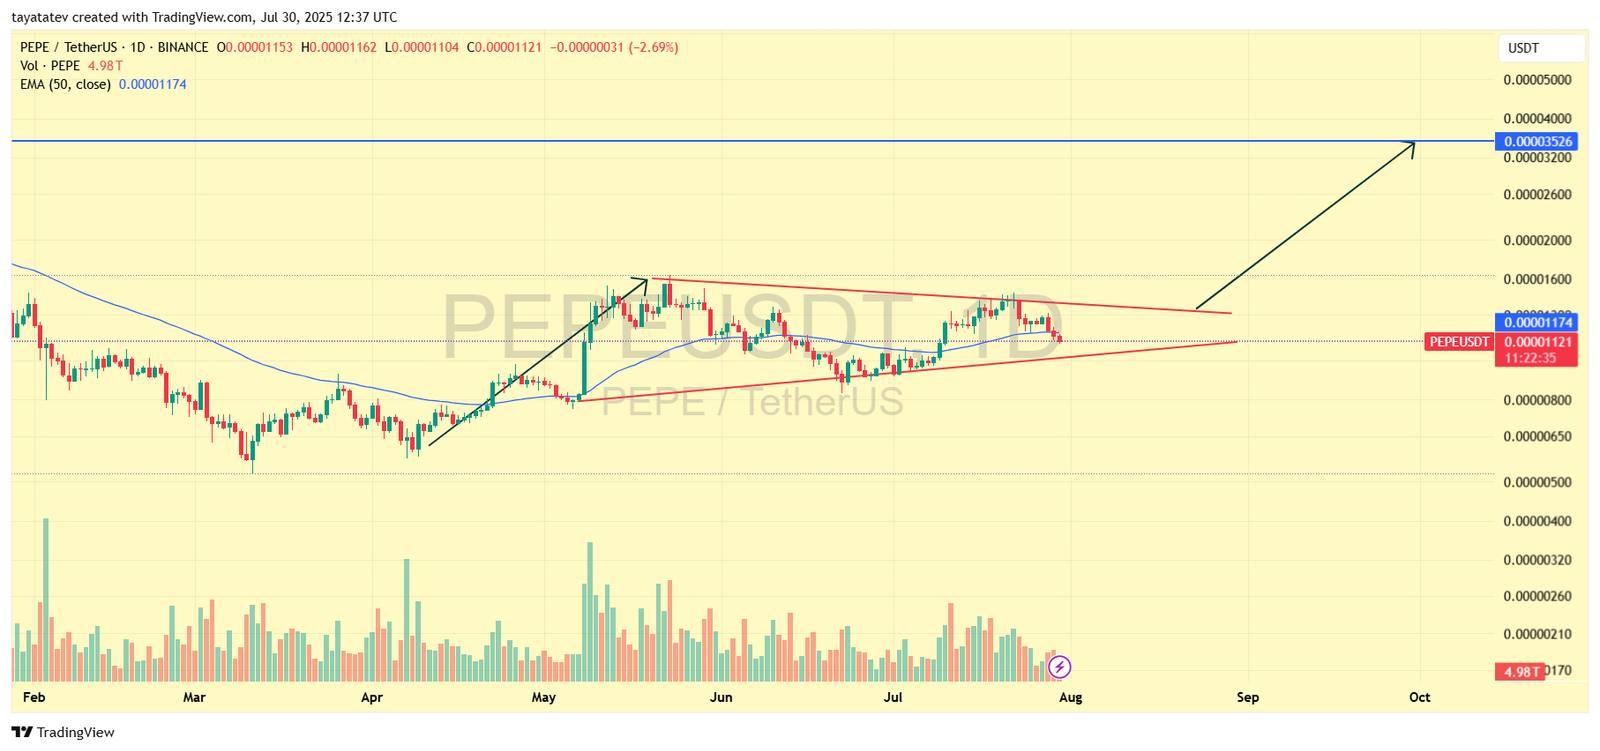
Pepe Coin is trading at $0.00001121, close to the 50-day Exponential Moving Average (EMA) at $0.00001174. The price has been consolidating within the pennant boundaries after its recent upward move. If this pattern confirms, the price could rise by approximately 215 percent from the current level to reach around $0.00003526.
Trading volume has decreased during the consolidation phase, which aligns with typical pennant behavior as market participants wait for a breakout. The EMA is trending below the price structure, acting as support and reinforcing the bullish outlook.
The Relative Strength Index (RSI) is not shown on the chart but can typically add further confirmation if it trends upward during a breakout. As the price approaches the pennant’s upper boundary, any decisive move above it accompanied by higher trading volume could indicate pattern confirmation.
The breakout target aligns with previous resistance levels near $0.00003526, making it a significant zone to watch. Continued alignment of price with the EMA and narrowing pennant structure increases the likelihood of a strong move if the pattern holds.
This analysis highlights that Pepe Coin remains at a key technical point, with the pennant suggesting potential upward continuation if confirmed with volume and price action.
Pepe Coin MACD Analysis Shows Bearish Crossover
The Pepe Coin (PEPE) to Tether (USDT) chart created on July 30, 2025, displays the Moving Average Convergence Divergence (MACD) indicator. The MACD consists of two lines: the MACD line (blue) and the signal line (orange), along with the histogram that measures their difference.
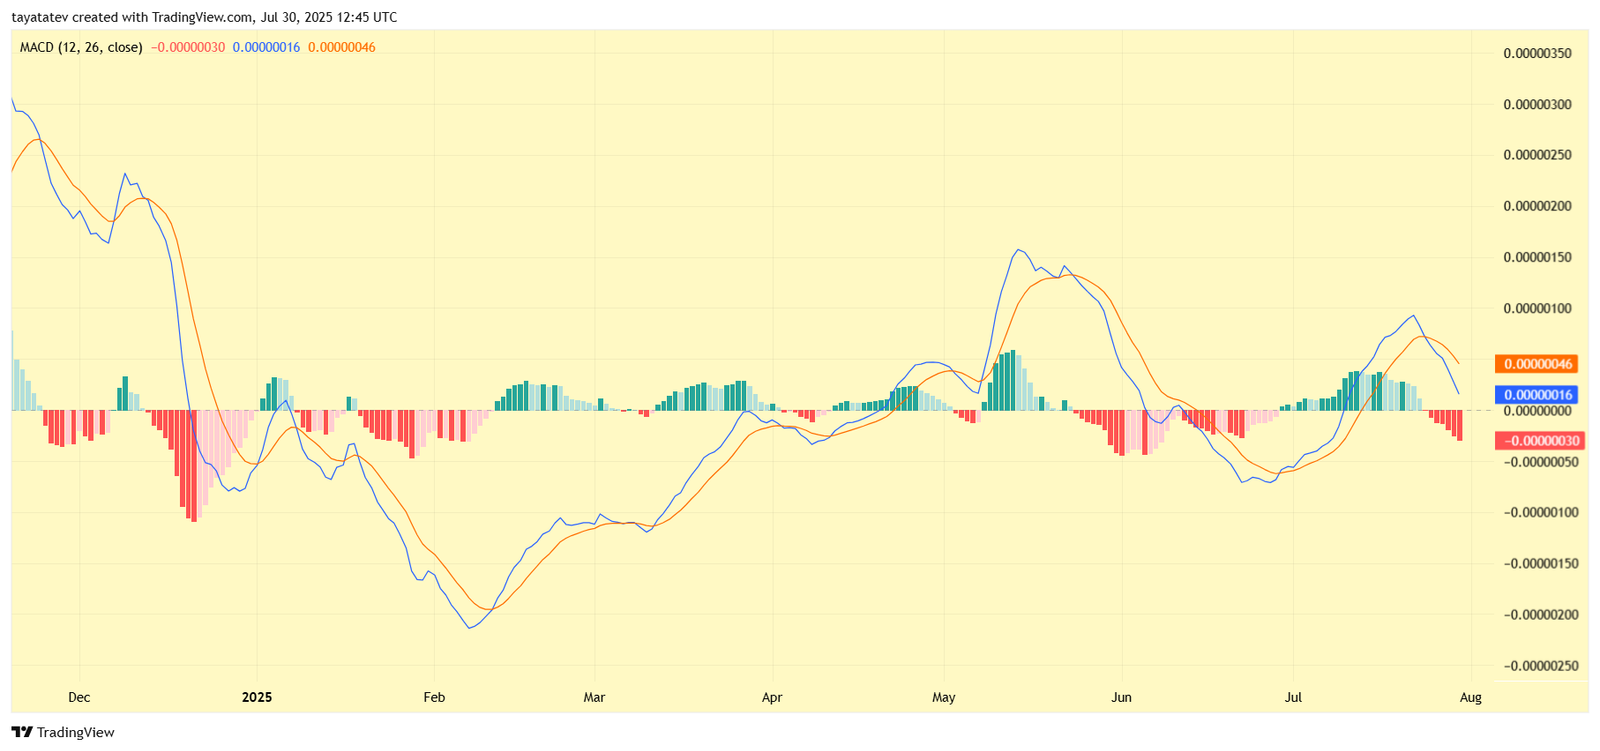
Currently, the MACD line has crossed below the signal line, forming a bearish crossover. This suggests weakening bullish momentum and potential downside pressure in the short term. The histogram bars have shifted into the negative region, confirming this bearish sentiment.
The MACD value stands at -0.00000030, with the signal line at 0.00000046 and the MACD line at 0.00000016. This spread indicates that momentum is turning negative. The histogram also shows increasing red bars, which often signals stronger bearish pressure as sellers gain control.
This shift follows a recent positive phase where the MACD histogram remained above zero during July. However, the decline and crossover now point to reduced buying strength. A sustained move below zero on the MACD histogram could reinforce further weakness unless price action reverses or another bullish crossover forms.
Pepe Coin RSI Signals Weakening Momentum
The Pepe Coin (PEPE) to Tether (USDT) chart created on July 30, 2025, displays the Relative Strength Index (RSI). The RSI is a momentum oscillator that measures the speed and change of price movements on a scale from 0 to 100.
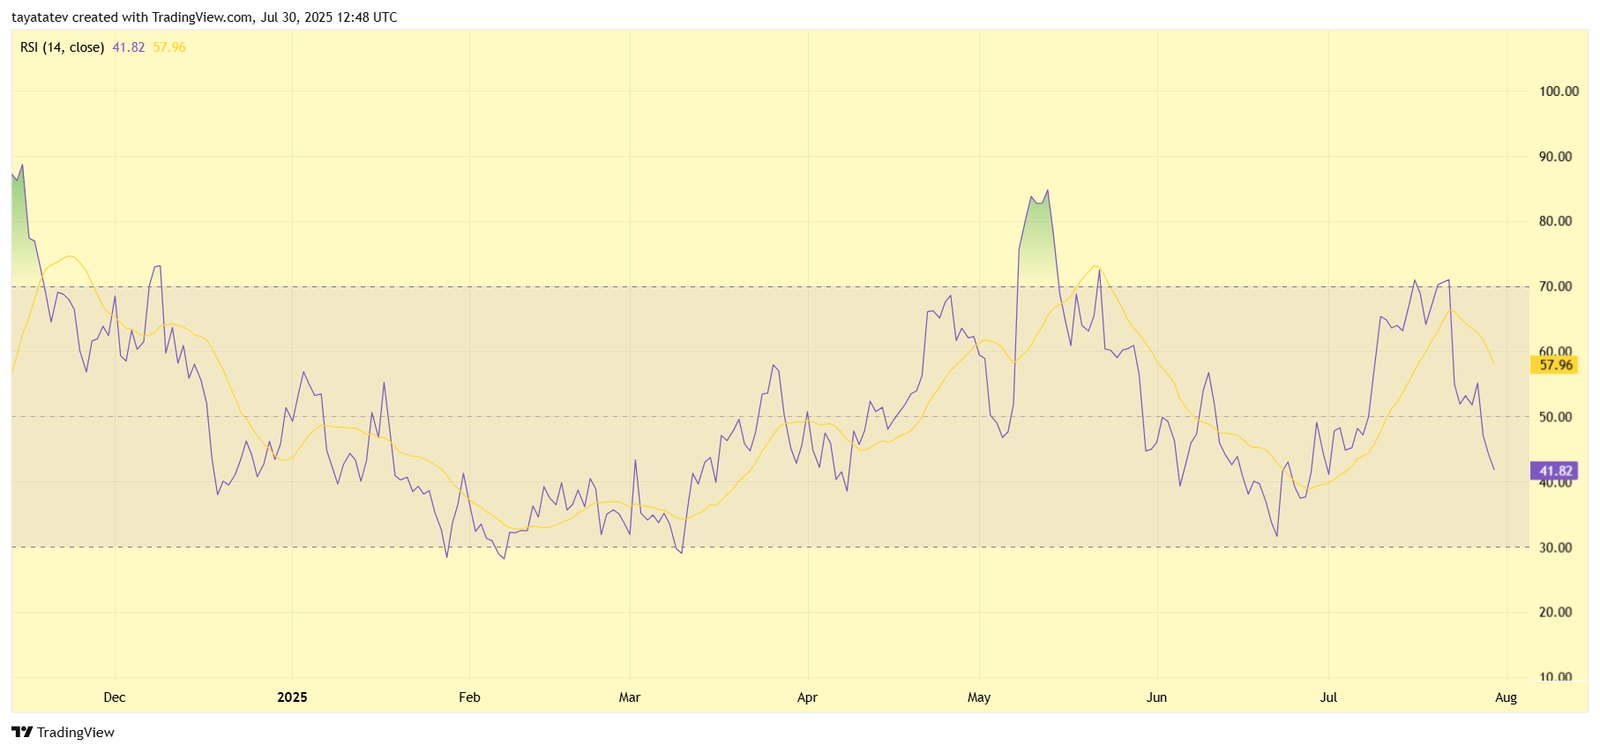
The current RSI value is 41.82, indicating that Pepe Coin is in the lower neutral zone but approaching oversold territory. The RSI’s moving average stands at 57.96, showing a notable decline from recent highs. This drop reflects reduced buying pressure and a shift toward bearish momentum.
Earlier in July, the RSI moved near 70, signaling strong bullish momentum. However, it failed to break into overbought levels and has since retreated sharply. This decline suggests that sellers have gained control, pulling the RSI toward levels that often precede further price corrections if downward pressure persists.
If the RSI falls closer to 30, it would enter oversold territory, typically associated with potential price stabilization or rebounds. For now, its current trajectory shows weakening momentum aligned with recent bearish developments in price action.
