Ali, a crypto analyst, noted on X that “$XRP continues to pull back after the TD Sequential flashed a sell signal on the 3-day chart. The next key support level to watch is $2.40.”
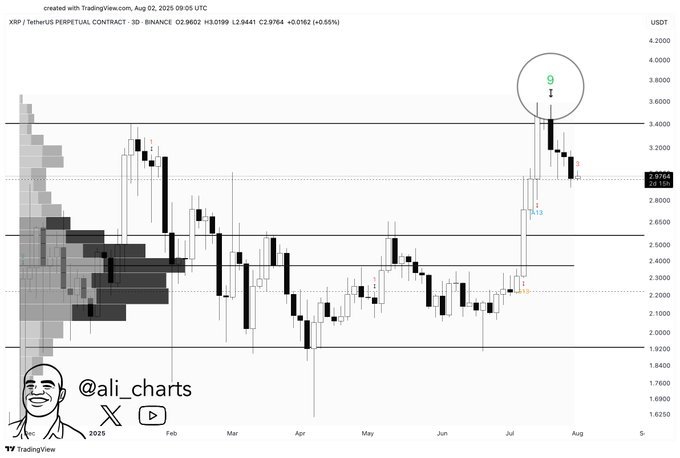
The chart shows XRP’s rally topping near $3.60, where the TD Sequential indicator printed a “9” candle, signaling a potential trend exhaustion. This was followed by consecutive bearish candles, confirming a short-term reversal.
Volume profile data highlights a dense trading zone between $2.40 and $2.80, where significant buying and selling activity previously occurred. This area represents a potential support base that could slow the decline.
The chart also shows clear horizontal levels, with $3.60 acting as resistance and $2.40 as the next key support. If XRP fails to hold near the mid-range zone around $2.80, price could retest $2.40. Conversely, reclaiming strength above $3.20 would be necessary to invalidate the bearish setup and reattempt the $3.60 resistance.
This analysis underscores how the TD Sequential signal, coupled with the volume profile and horizontal support zones, points toward continued corrective pressure unless buyers regain control.
XRP Forms Bullish Flag, Targeting 67% Upside
On August 3, 2025, XRP/USDT formed a bullish flag pattern on the 4-hour chart. A bullish flag is a continuation pattern that appears after a strong upward move, where price consolidates within parallel descending lines before potentially breaking upward to resume its prior trend. In this case, XRP surged sharply before entering a controlled pullback channel, creating the flag structure.
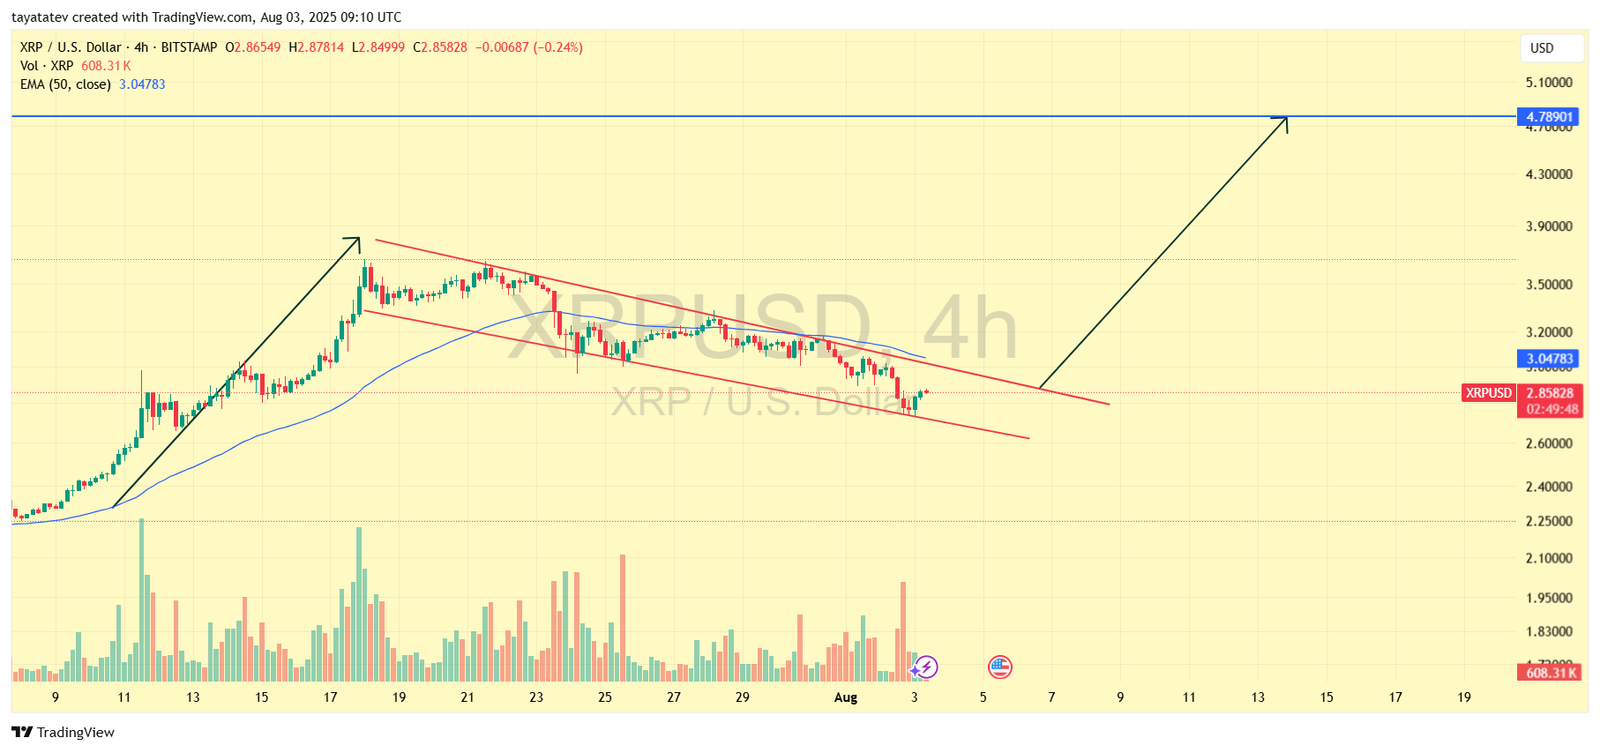
The price action shows clear downward-sloping resistance and support lines while staying above significant volume clusters, reinforcing the pattern’s validity. The 50-period Exponential Moving Average, which is a technical indicator that smooths price data to highlight trends, is positioned near the flag’s upper boundary, acting as dynamic resistance that aligns with the breakout zone.
If XRP confirms the breakout above the flag’s resistance with strong volume, it could rise by approximately 67 percent from its current level toward the projected target of $4.78. This projection is based on the measured move technique, which adds the height of the initial rally, known as the flagpole, to the breakout point. The volume spike near the lower boundary further supports the likelihood of accumulation during consolidation, which often precedes upward continuation.
Additionally, price behavior around the $3.05 level, which aligns with the 50-period Exponential Moving Average, will be crucial for validating bullish momentum. A decisive move above this level would strengthen the breakout confirmation and open the path toward the $4.78 objective. The pattern’s structure, combined with rising volume near support and a tightening range, suggests growing pressure that could soon trigger an upward breakout consistent with historical bullish flag behavior.
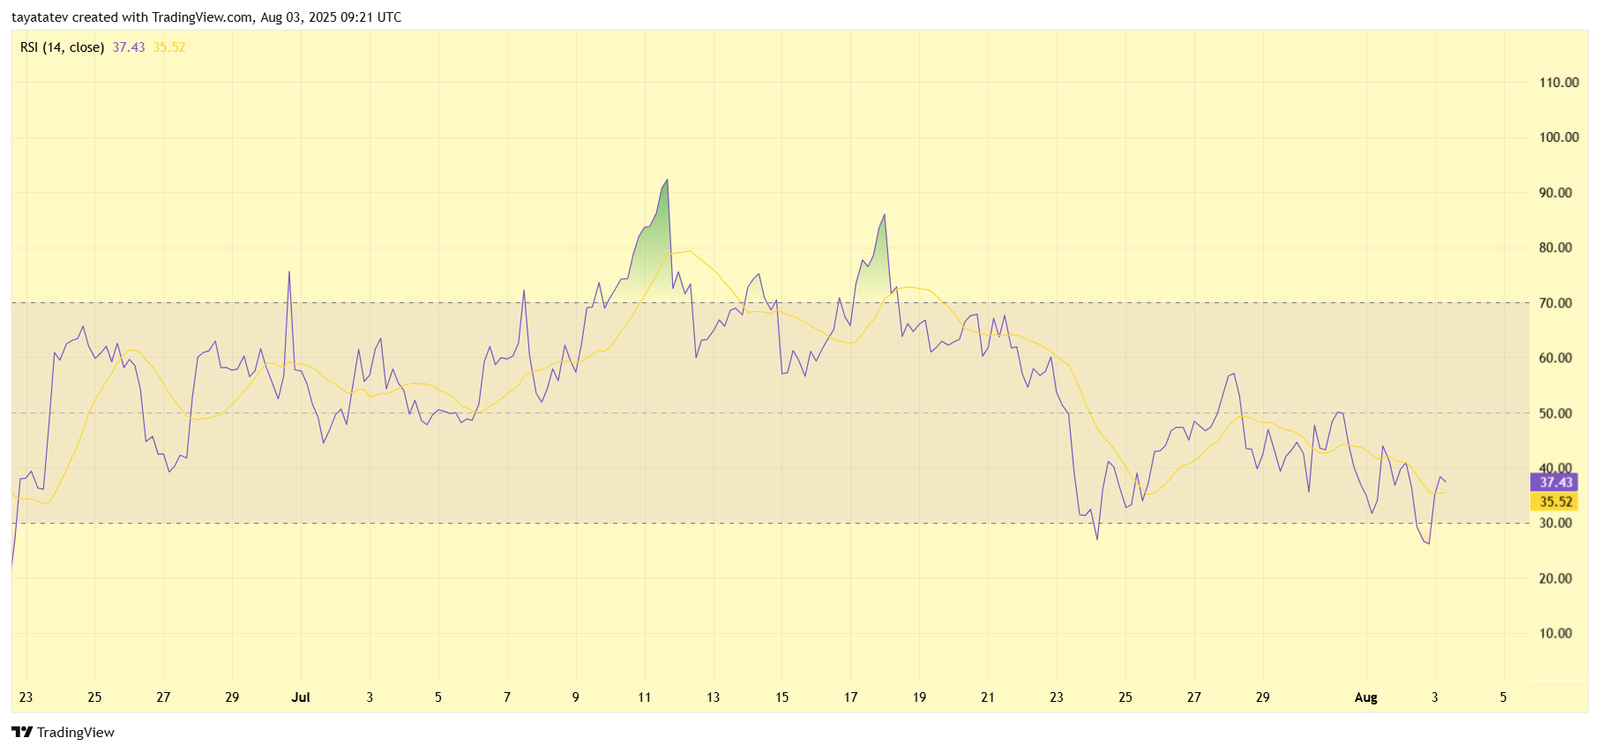
XRP Stochastic Momentum Index Signals Potential Upside
The chart, created on August 3, 2025, shows XRP’s Stochastic Momentum Index (SMI) fluctuating in the lower region, with values currently at -36.41 for the blue line and -45.17 for the orange signal line. The SMI, which measures price momentum relative to its recent high-low range, indicates oversold conditions when readings remain below -40.
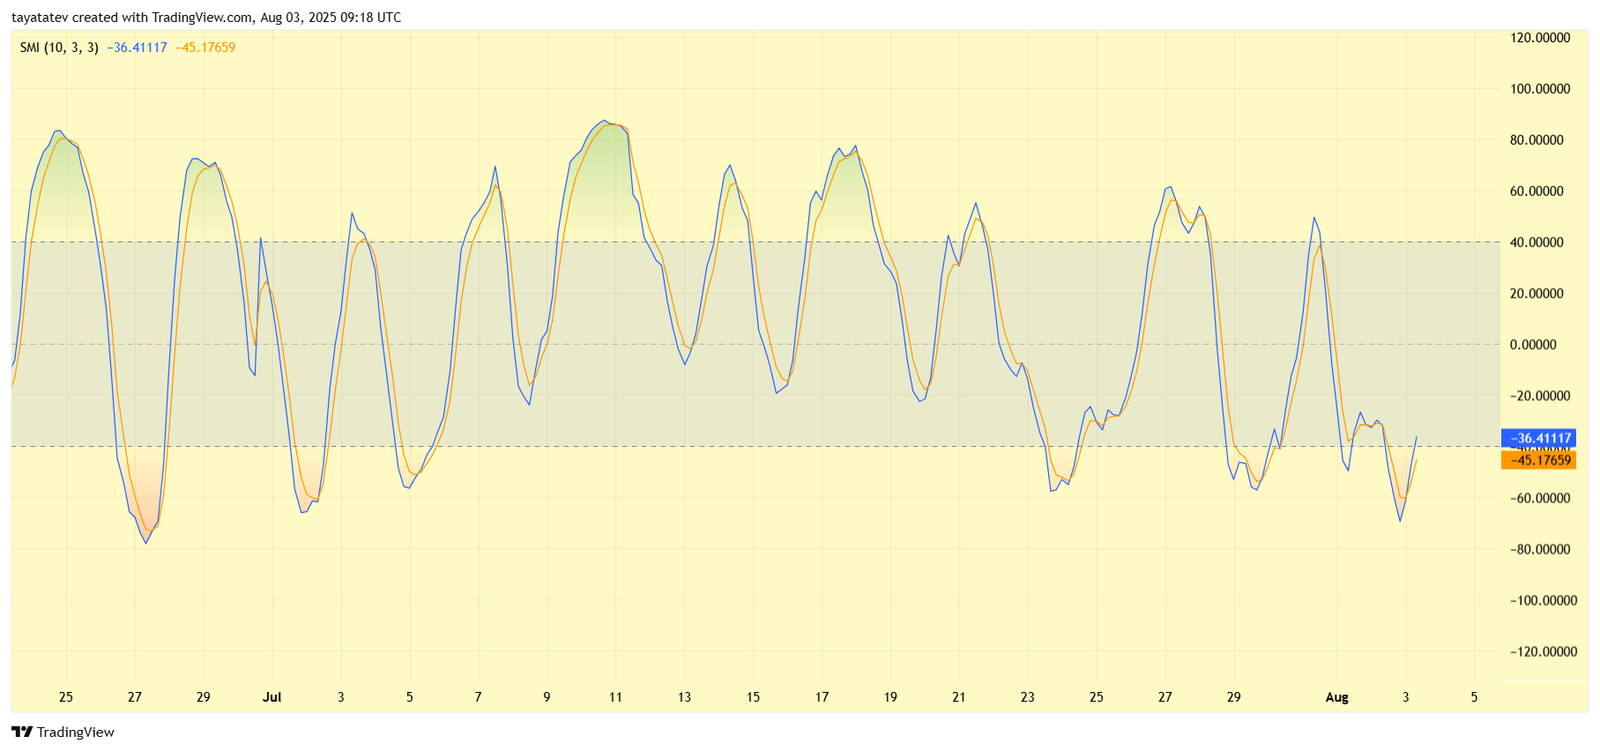
Both lines recently crossed upward from near the oversold zone, suggesting a potential bullish reversal. Historically, such upward crossovers from deep negative levels often precede short-term upward price movements, especially when they coincide with broader chart patterns, such as the bullish flag previously observed on XRP’s price chart.
The repeated oscillations between overbought and oversold zones reflect strong volatility, with XRP’s recent dips driving momentum lower before quickly rebounding. This rebound, if sustained, could align with increased buying pressure and support a move toward higher levels. The oversold recovery, coupled with tightening crossover action, indicates growing momentum strength that could reinforce a breakout from consolidation zones.