
As cryptocurrency markets heat up in what traders are calling “altseason,” several leading altcoins are showing decisive technical setups that could define the coming weeks. Solana, Avalanche, and Polkadot have each formed clear chart patterns backed by strong volume and momentum signals, suggesting significant moves ahead. From bullish pennant breakouts to potential bearish reversals, these three assets are drawing heightened attention from market participants looking to capture the next major swing.
Solana Bullish Pennant Breakout Targets $238
August 13, 2025. On the Coinbase four hour chart, Solana has completed a bullish pennant pattern, a continuation formation where price consolidates in a narrowing range after a strong advance before resuming the prior uptrend. The pattern formed following the steep rally in mid-July, with price compressing between converging support and resistance lines while maintaining an overall bullish bias.
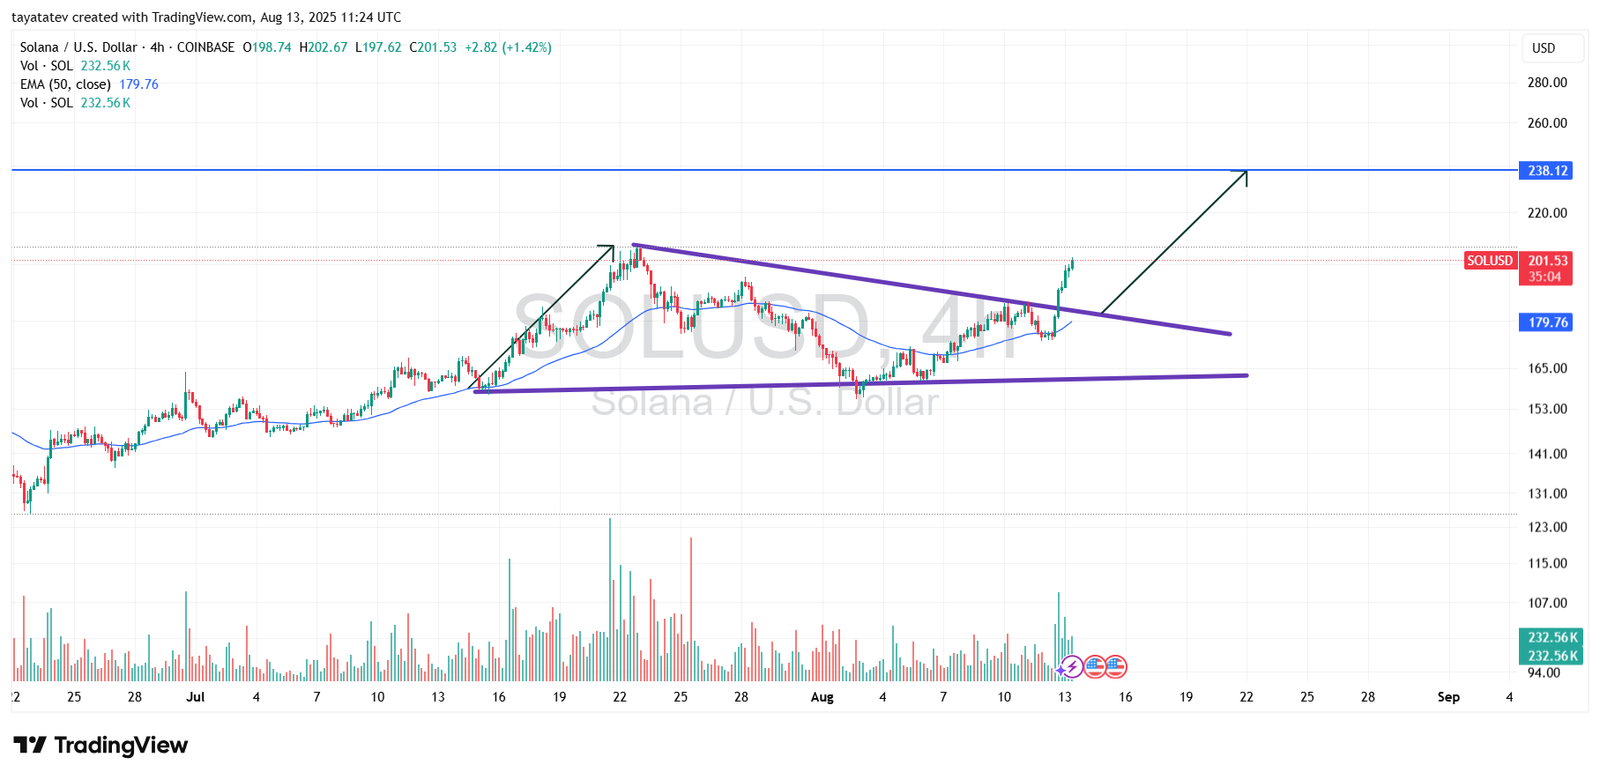
This week’s price action shows Solana breaking above the pennant’s upper trendline with force. Since the breakout, the token has gained roughly eight percent, moving from the breakout level to the current price of 201.53 United States dollars. Based on the measured move method, which applies the height of the prior rally to the breakout point, the next upside objective sits near 238.12 United States dollars. This projection implies an additional eighteen percent upside from current levels.
The bullish case is reinforced by technical signals. The fifty period exponential moving average, currently at 179.76 United States dollars, continues to rise, acting as dynamic support. Volume expanded noticeably during the breakout, confirming strong participation from buyers. Candles have consistently closed near session highs since the move began, reflecting sustained momentum. If this momentum persists, Solana could approach its target quickly, with minimal resistance until the projected level is reached.
Solana RSI Enters Overbought Zone Amid Strong Breakout
August 13, 2025. The Relative Strength Index (RSI) for Solana has surged to 75.83, pushing decisively above the overbought threshold of 70. The RSI, which measures the speed and magnitude of price changes, is accompanied by its yellow signal line at 57.81, which is trending higher and confirming upward momentum. The move into overbought territory follows the recent breakout from a bullish pennant pattern, showing that buyers have maintained aggressive pressure after clearing resistance.
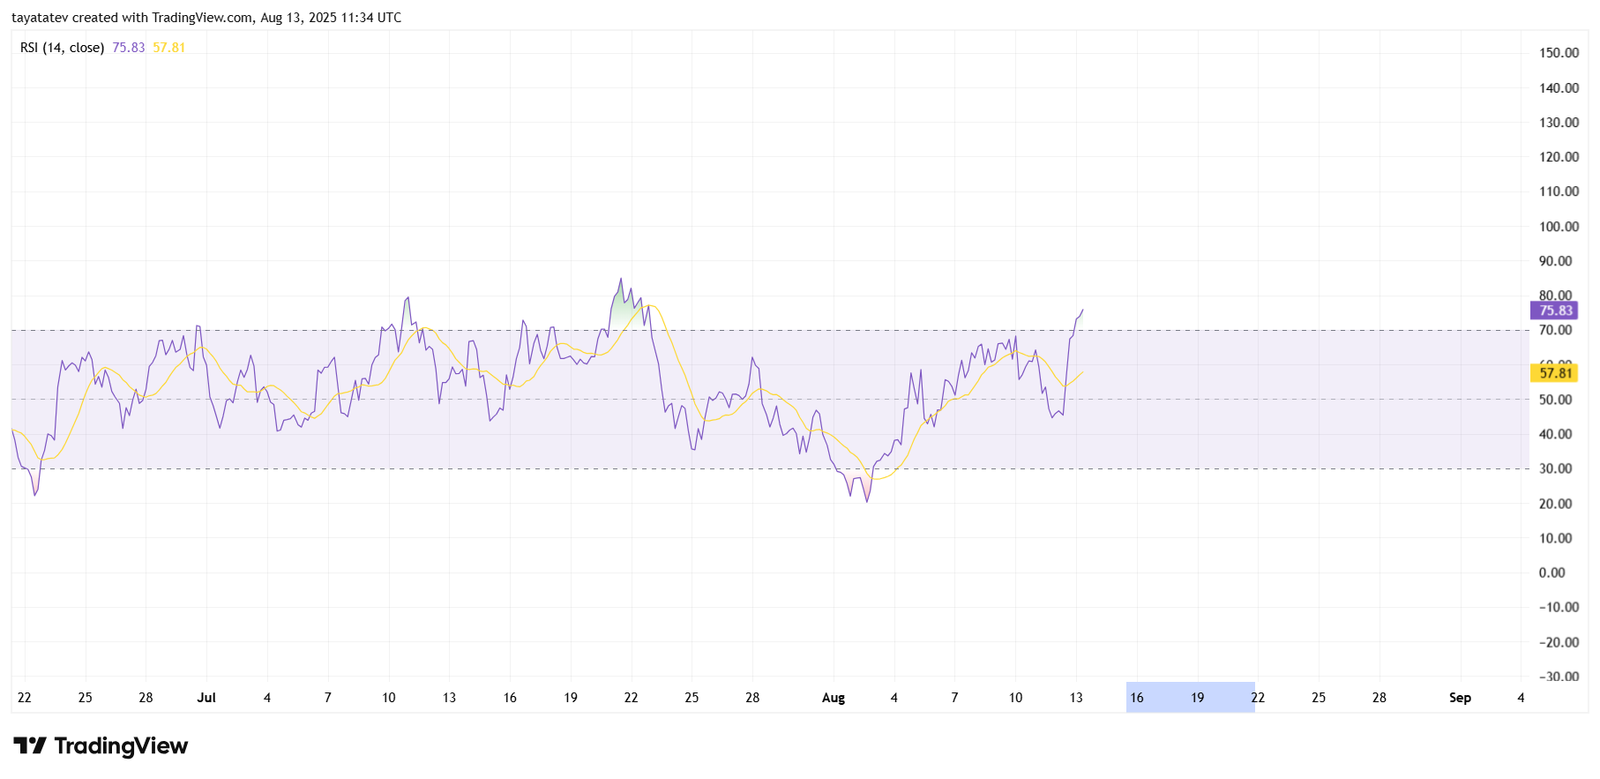
This is the highest RSI reading since mid-July, when Solana’s price rallied sharply before entering a consolidation phase. Historically, such elevated RSI levels have preceded short-term cooling periods, but they can also occur during strong trending phases when buying interest remains dominant. The current alignment between the RSI and its signal line suggests that bullish momentum is firmly in control, with no immediate signs of reversal.
As long as the RSI remains above 70 and the signal line continues to rise, Solana is likely to sustain upward pressure toward the projected target of 238.12 United States dollars, although traders should remain aware that overbought conditions can trigger short-term pullbacks if buying enthusiasm fades.
Avalanche Forms Bearish Flag, Risking Deeper Decline
August 13, 2025. On the four hour chart, Avalanche AVAX/USD has formed a bearish flag pattern, which is a continuation structure where price rebounds in a narrow, upward-sloping channel after a sharp sell-off before resuming the prior downward move. This pattern emerged after the steep late July decline, with price climbing gradually inside parallel trendlines while volume contracted.
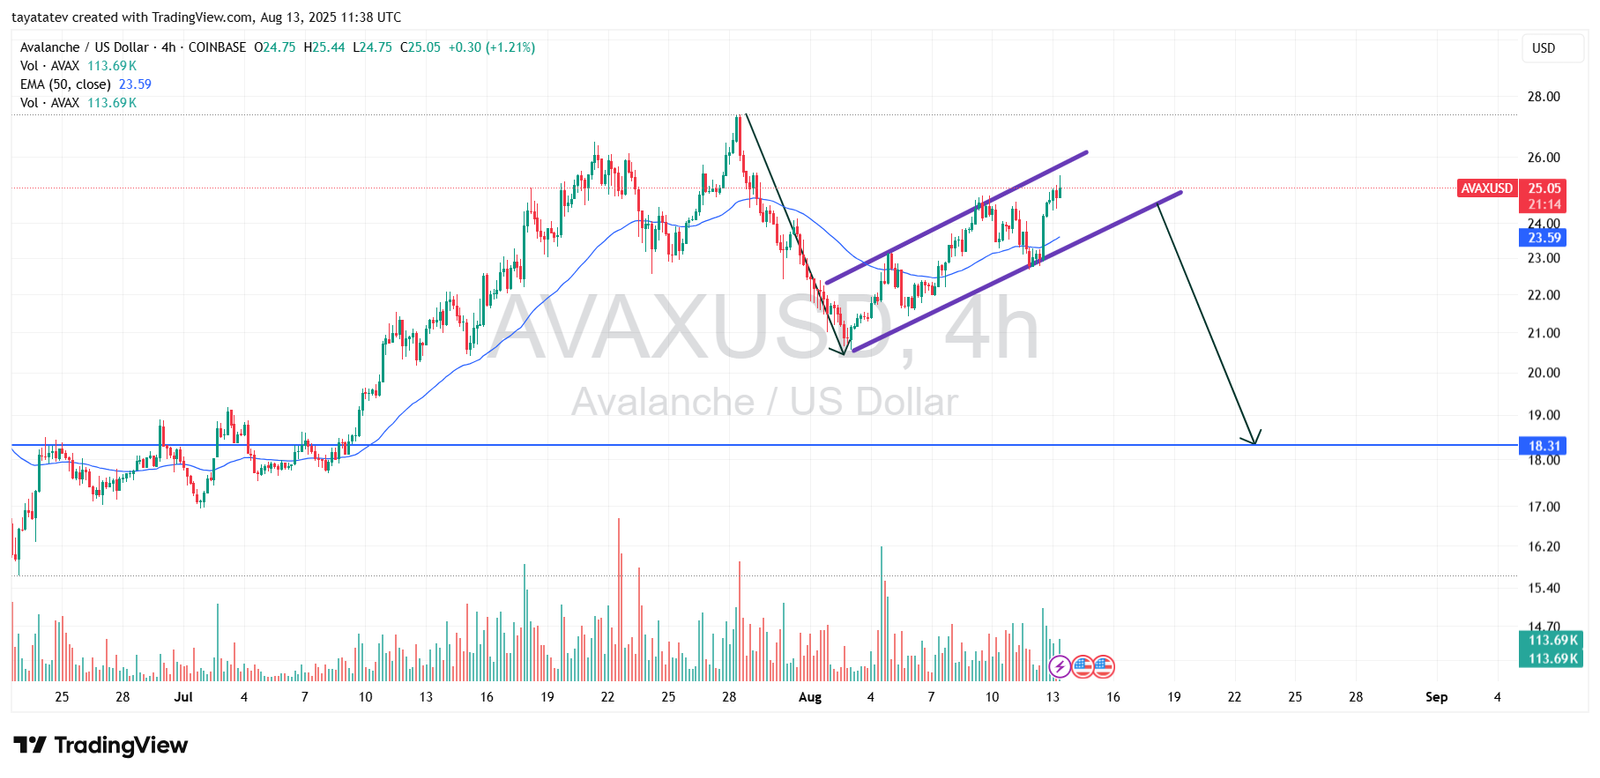
At the current level of 25.05 United States dollars, the setup remains intact, and if confirmed with a break below the lower boundary near the fifty period exponential moving average at 23.59 United States dollars, it would imply a measured move of roughly twenty-seven percent to the downside. That projection places the target around 18.31 United States dollars, matching the depth of the preceding drop.
The price action shows repeated hesitation at the channel’s upper resistance, suggesting sellers are still active. Volume behavior supports the bearish case, as the most significant spikes came during the initial sell-off rather than the recovery phase. If momentum shifts back in favor of sellers and volume expands on a downside break, the flag’s measured target could be reached quickly.
Avalanche RSI Rises but Stays Below Overbought Threshold
August 13, 2025. The Relative Strength Index (RSI) for Avalanche stands at 63.47, sitting below the overbought threshold of 70 but showing a steady climb from the recent pullback. The RSI, which measures the speed and magnitude of recent price movements, is accompanied by its yellow signal line at 53.20, which is also trending upward. This alignment reflects improving bullish momentum following a period of consolidation.
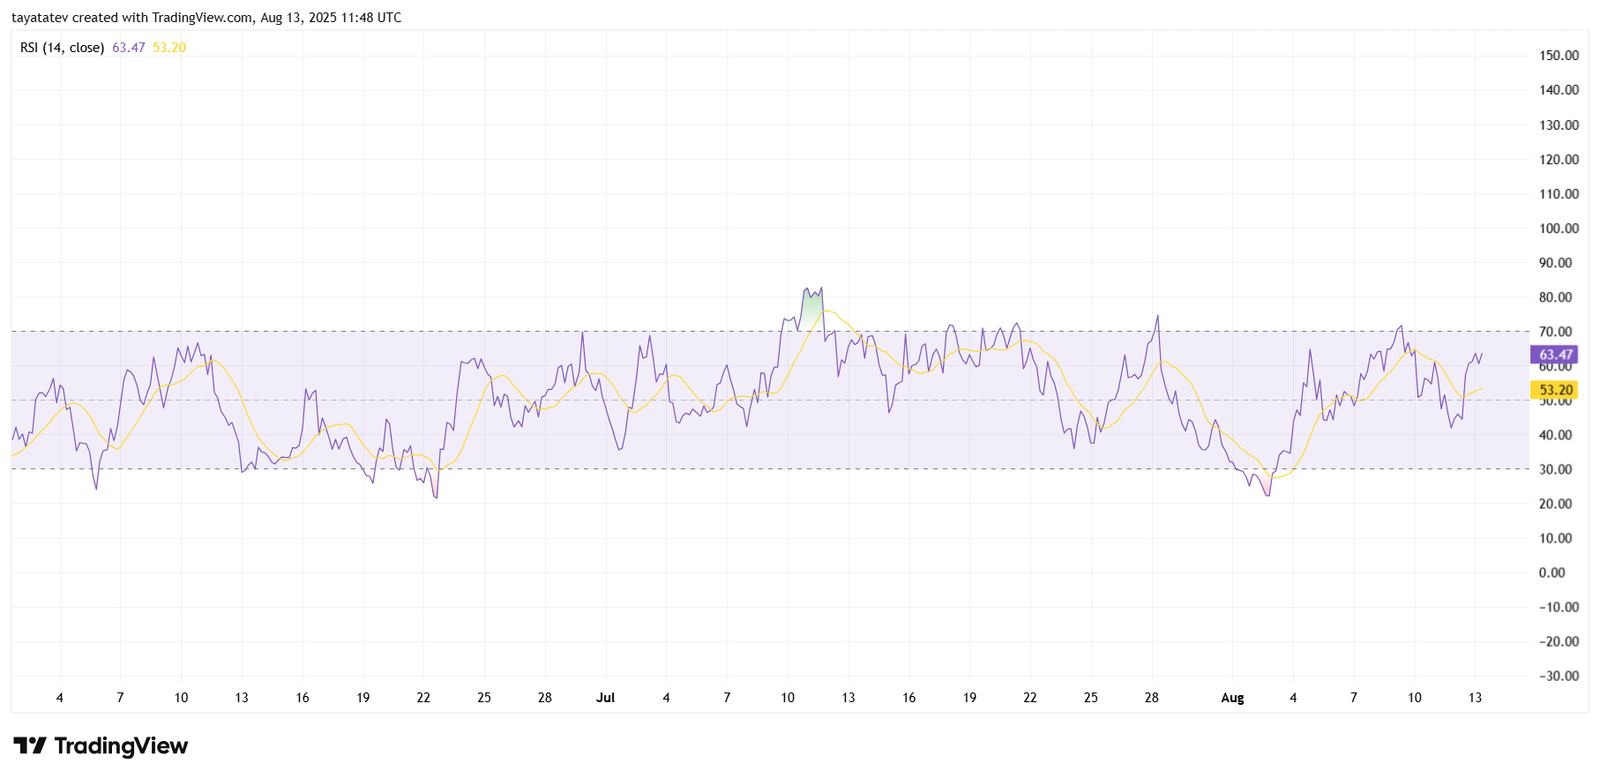
While the reading is not yet in overbought territory, the RSI’s upward trajectory suggests buyers are regaining control after the recent decline. Historically, Avalanche has approached the 70 level before encountering resistance or slowing momentum, making the current mid-60s zone a potential staging ground for another test higher.
The positive crossover earlier in August, when the RSI moved back above its signal line, marked the shift from neutral to bullish bias. However, traders will be watching closely as the indicator nears the overbought zone, since a failure to break higher could align with a resumption of selling pressure suggested by the bearish flag pattern on the price chart.
Polkadot Breaks Bullish Pennant, Targeting $5.458
August 13, 2025. On the four hour chart, Polkadot DOT/USD has formed and broken out of a bullish pennant pattern, which is a continuation setup where price consolidates in a small, symmetrical triangle after a sharp upward move before continuing higher in the same direction. This formation emerged after the strong rally in mid-July, with price compressing between converging support and resistance trendlines while holding above the fifty period exponential moving average at 3.960 United States dollars.
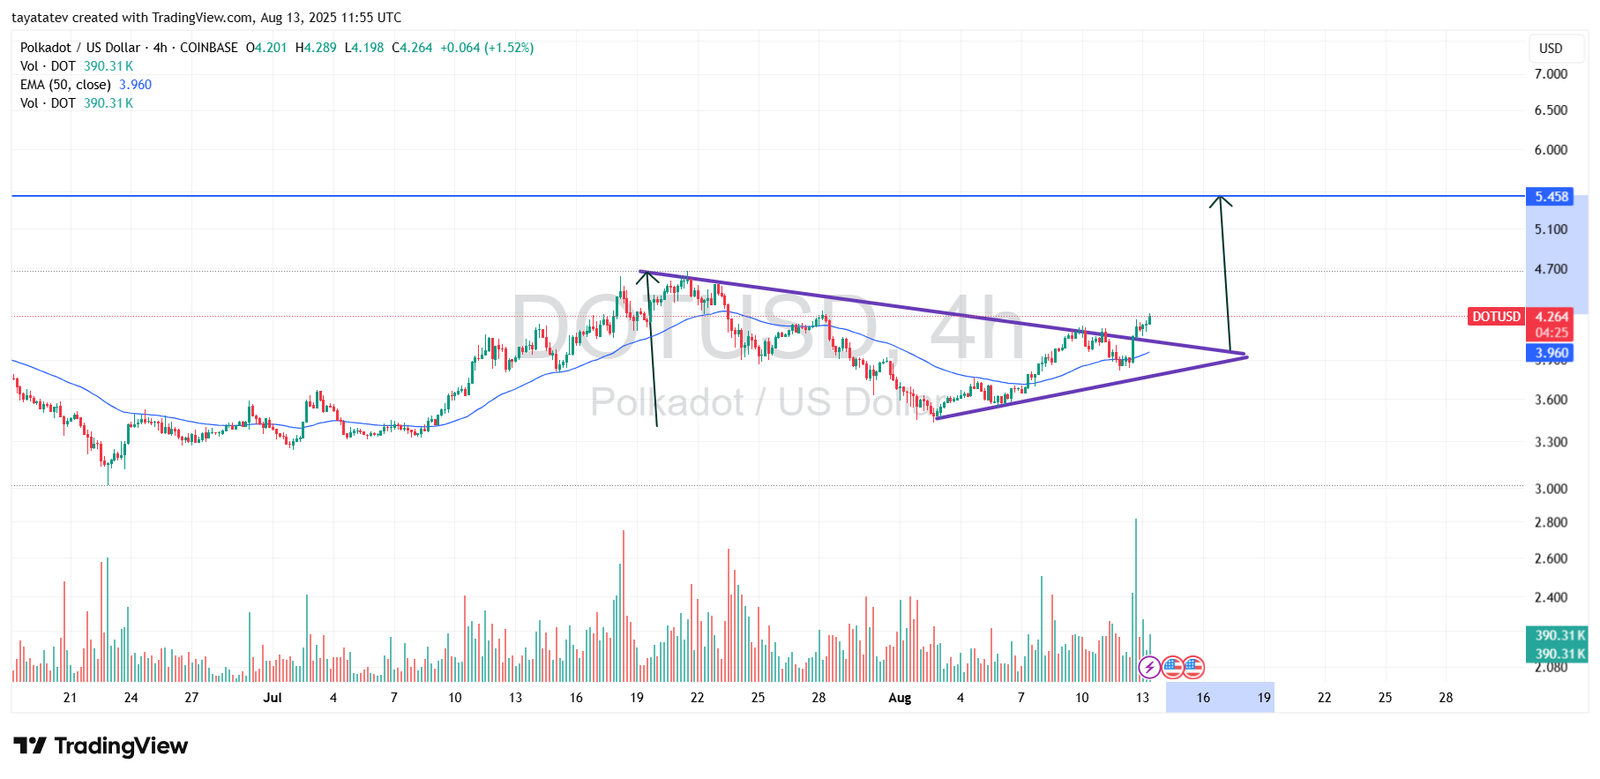
Price has already moved approximately five percent above the pennant’s upper boundary, confirming the breakout and signaling strong buying momentum. Based on the measured move principle, which applies the height of the initial rally to the breakout point, the next upside objective sits near 5.458 United States dollars. This projection represents an additional twenty-seven percent advance from the current price of 4.264 United States dollars.
Volume has expanded noticeably during the breakout, supporting the bullish scenario and indicating that buyers are actively participating in the move. Candles have been closing near their session highs, reflecting persistent demand. With the technical structure intact and momentum indicators pointing higher, Polkadot appears well-positioned to continue its advance toward the projected target, provided it maintains support above the breakout level.
Polkadot RSI Nears Overbought Zone as Momentum Strengthens
August 13, 2025. The Relative Strength Index (RSI) for Polkadot is currently at 67.06, approaching the overbought threshold of 70. The RSI measures the speed and magnitude of recent price changes, and readings above 70 often suggest overbought conditions, while levels below 30 indicate oversold conditions. The yellow signal line, representing the moving average of the RSI, stands at 55.00 and is trending upward, confirming building bullish momentum.
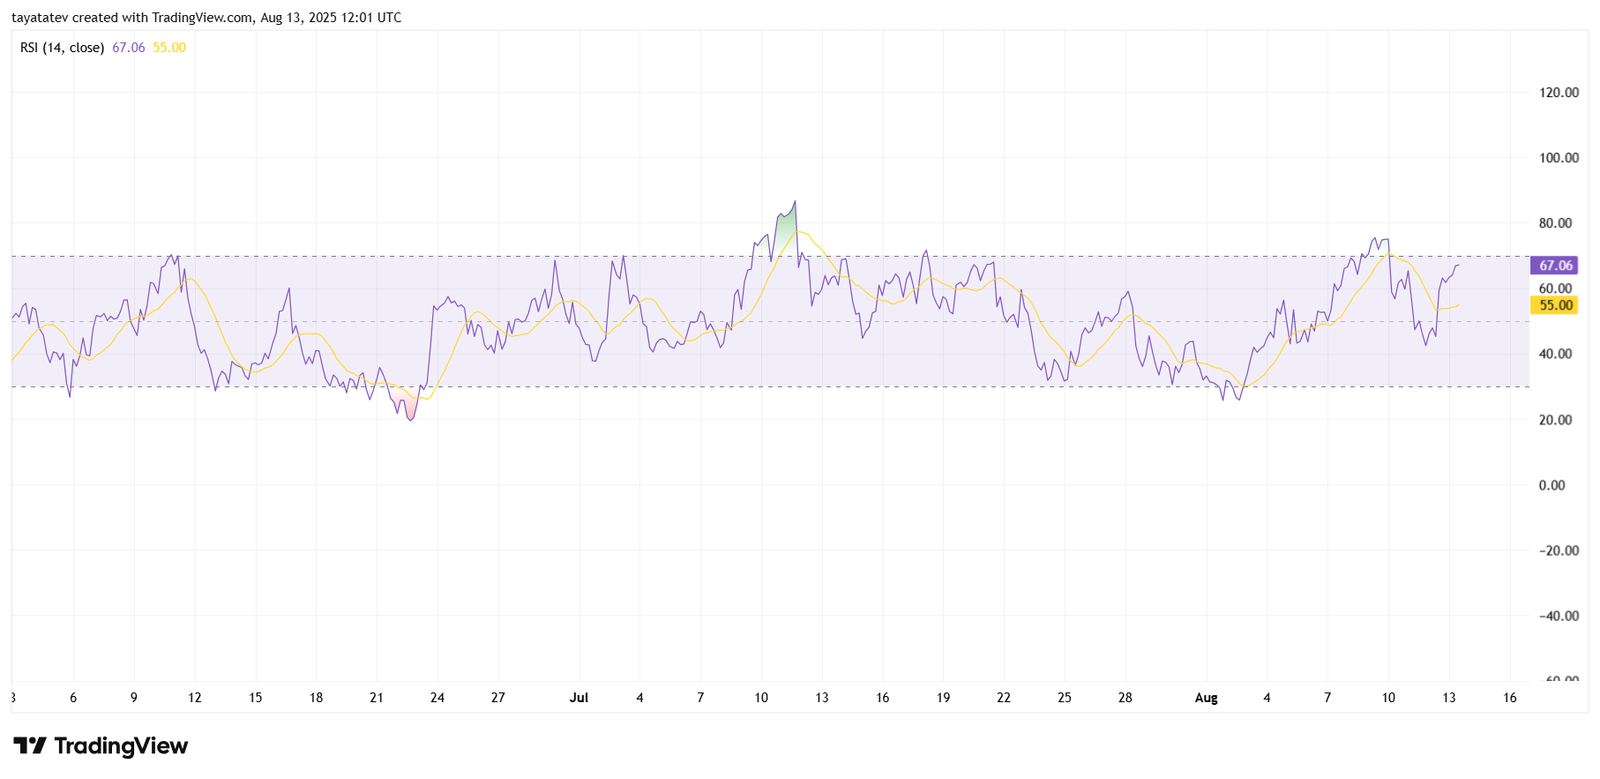
This latest rise in the RSI follows the breakout from a bullish pennant pattern on the price chart, indicating that momentum has shifted decisively in favor of buyers. The indicator’s climb from the mid-40s earlier this month shows sustained buying pressure, and the positive spread between the RSI and its signal line reinforces the bullish outlook.
While the reading has not yet crossed into overbought territory, the upward trajectory suggests that Polkadot could soon test the 70 level if buying interest continues. Historically, such levels have been associated with strong trending moves, although they can also precede short-term pauses or pullbacks. For now, the RSI behavior supports the continuation of the rally toward the projected target of 5.458 United States dollars.
