How High Can Litecoin (LTC) Price Go This Bull Cycle?

Tatevik Avetisyan
By Tatevik Avetisyan 3 Min Read
How High Can Litecoin (LTC) Price Go This Bull Cycle

Litecoin has moved above a long-term descending trendline, signaling a potential shift in market momentum. The breakout appears on the 4-day Kraken chart, which tracks LTC/USD since 2018, and shows the price currently at $132.37.

The chart outlines an Elliott Wave structure, with the latest move suggesting the start of a new impulsive wave. Analysts from More Crypto Online note that even in the conservative “white scenario,” Litecoin could reach at least $362. This projection aligns with Fibonacci extensions visible on the chart, where targets extend toward $280.10, $362.71, $435.31, and $549.20, depending on market strength.

- Advertisement -
Litecoin Long-Term Chart. Source: More Crypto Online

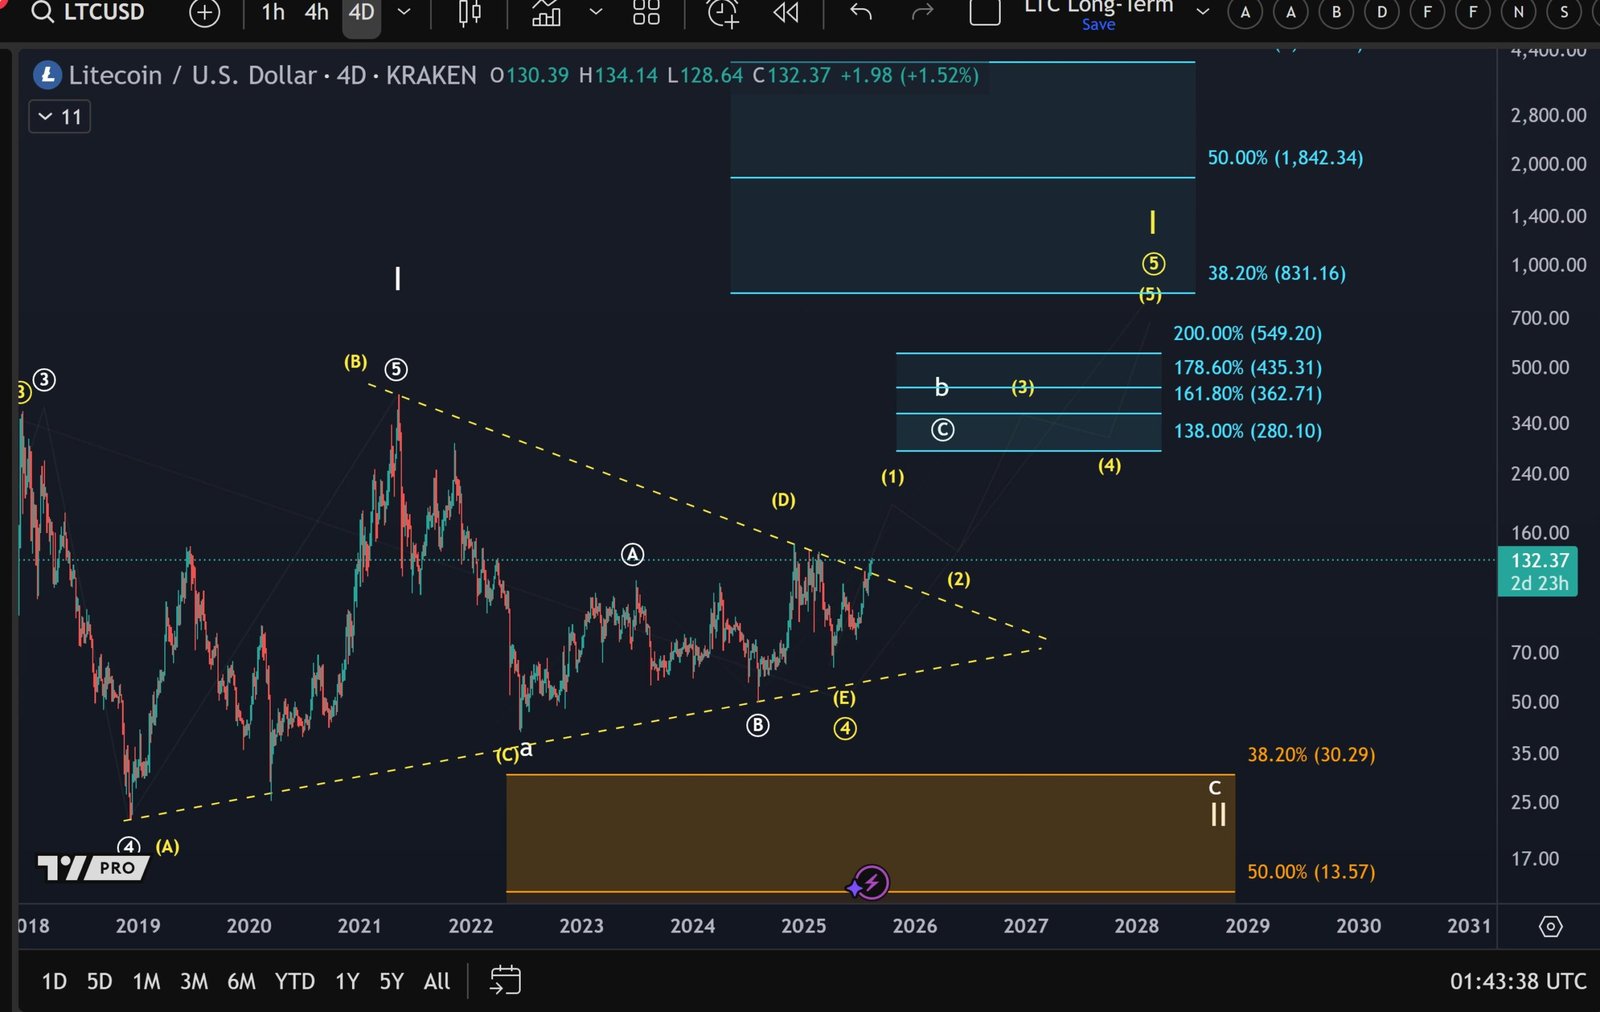
However, the bullish setup hinges on holding above the June low of $77. A drop below this level would break the recent upward momentum and could trigger a deeper retracement. The multi-year symmetrical triangle, highlighted with yellow dotted lines, shows that LTC has been consolidating since 2021, with repeated tests of both upper resistance and lower support.

The breakout now places price action in a zone where long-term upside targets, including $831.16 and higher extensions, are in view if the trend sustains. Traders are watching whether LTC can maintain its position above the breakout point to confirm the bullish continuation.

Litecoin RSI Nears Overbought Zone as Bullish Momentum Builds

The RSI (Relative Strength Index) chart for Litecoin, set on a 14-period close, shows a current reading of 68.24, with its moving average at 64.47.

Litecoin RSI 14. Source: TradingView

Over the past year, RSI has oscillated mostly between the 30 and 70 levels, with several spikes above 70 indicating short-term overbought conditions. In late May and late July 2025, RSI briefly moved into the overbought zone, suggesting heightened bullish momentum during those periods. Each time, price consolidation or pullbacks followed.

Currently, RSI is approaching the 70 threshold again, signaling that buying pressure remains strong after recent gains. The moving average’s position below the RSI line suggests upward momentum is still in play. However, proximity to the overbought level means a short-term correction could emerge if momentum weakens.

This RSI behavior aligns with the breakout seen on the long-term price chart, reinforcing the view that Litecoin’s bullish push is active, though close monitoring is needed for signs of exhaustion.

Tatevik Crypto Journalist CoinChapter

Tatevik Avetisyan

Tatev Avetisyan is a Markets Writer and Analyst at CoinChapter, covering cryptocurrency markets, policy, and regulation. With over seven years of experience in business and marketing development, she has spent the past two years specializing in digital assets and has authored more than 2,000 articles on crypto markets and regulatory developments.She contributes as a guest writer to leading industry publications and is a prominent Web3 advocate in Armenia through Web3Armenia. Her work reflects a broader focus on artificial intelligence and Web3 technologies. Tatev maintains a diversified crypto portfolio, with Bitcoin as her primary holding above CoinChapter’s $1,000 disclosure threshold.