US Treasury Secretary Scott Bessent clarified that his department is still examining budget-neutral ways to buy Bitcoin for the Strategic Bitcoin Reserve. His statement came hours after earlier comments suggested otherwise, triggering a market sell-off.
In a post on X Thursday, Bessent said:
“Treasury is committed to exploring budget-neutral pathways to acquire more Bitcoin to expand the reserve, and to execute on the President’s promise to make the United States the ‘Bitcoin superpower of the world.’”
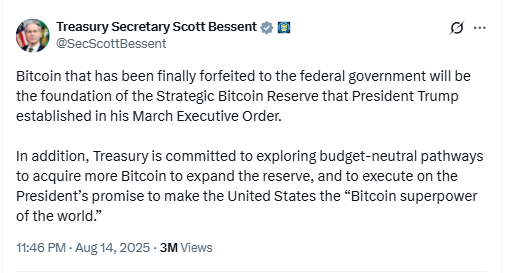
Bessent confirmed that Bitcoin forfeited to the federal government will serve as the reserve’s foundation. Concerns had grown that the slow pace of the reserve strategy could allow other nations to act first. Some observers feared the Treasury might not follow through on its buying plans.
Seven hours before the clarification, Bessent told FOX Business:
“We’ve also started to get into the 21st century, a Bitcoin reserve. We’re not going to be buying that, but we are going to use confiscated assets and continue to build that up.”
That remark erased $55 billion from Bitcoin’s market cap in about 40 minutes, with prices dropping from $121,073 to $118,886, according to CoinGecko. Despite the reversal, Bitcoin traded around $118,500 at press time.
Criticism Over Delayed Execution
The clarification reassured some holders, but others questioned the pace. Eli Nagar, CEO of Bitcoin mining firm Braiins, said on X:
“Are you seriously still ‘exploring budget-neutral pathways’? At some point, exploration without execution starts to look like avoidance.”
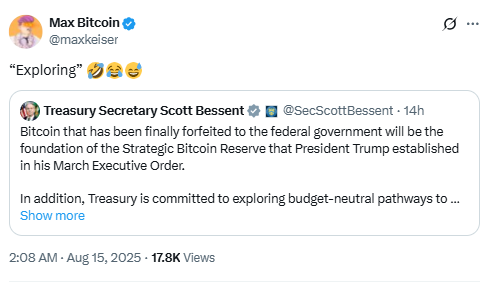
Max Keiser, adviser to El Salvador on Bitcoin policy, also criticized the prolonged use of “exploring.”
The Treasury has been discussing budget-neutral approaches for five months since Donald Trump signed an executive order on March 6. The order created both the Strategic Bitcoin Reserve and a Digital Asset Stockpile, starting with crypto seized in criminal cases. It also permitted additional Bitcoin purchases using strategies that do not impose costs on US taxpayers.
The Digital Asset Working Group’s recent report did not outline concrete execution steps. Ideas under consideration include revaluing gold certificates and using tariff revenue.
Congressional Approval May Be Needed
One reason for the delay may be the need for congressional approval to proceed. US Senator Cynthia Lummis urged lawmakers to review the BITCOIN Act, which she introduced in March, as a possible path forward.
Bessent also confirmed that the US does not plan to sell its existing Bitcoin holdings.
“We’re going to stop selling,”
he told FOX Business.
He estimated the Strategic Bitcoin Reserve’s current value at $15 billion to $20 billion. Data from BitBo’s Bitcoin Treasuries dashboard lists 198,012 BTC in US holdings, worth about $23.5 billion.
These figures align with previous reports that the holdings come primarily from seizures linked to criminal investigations.
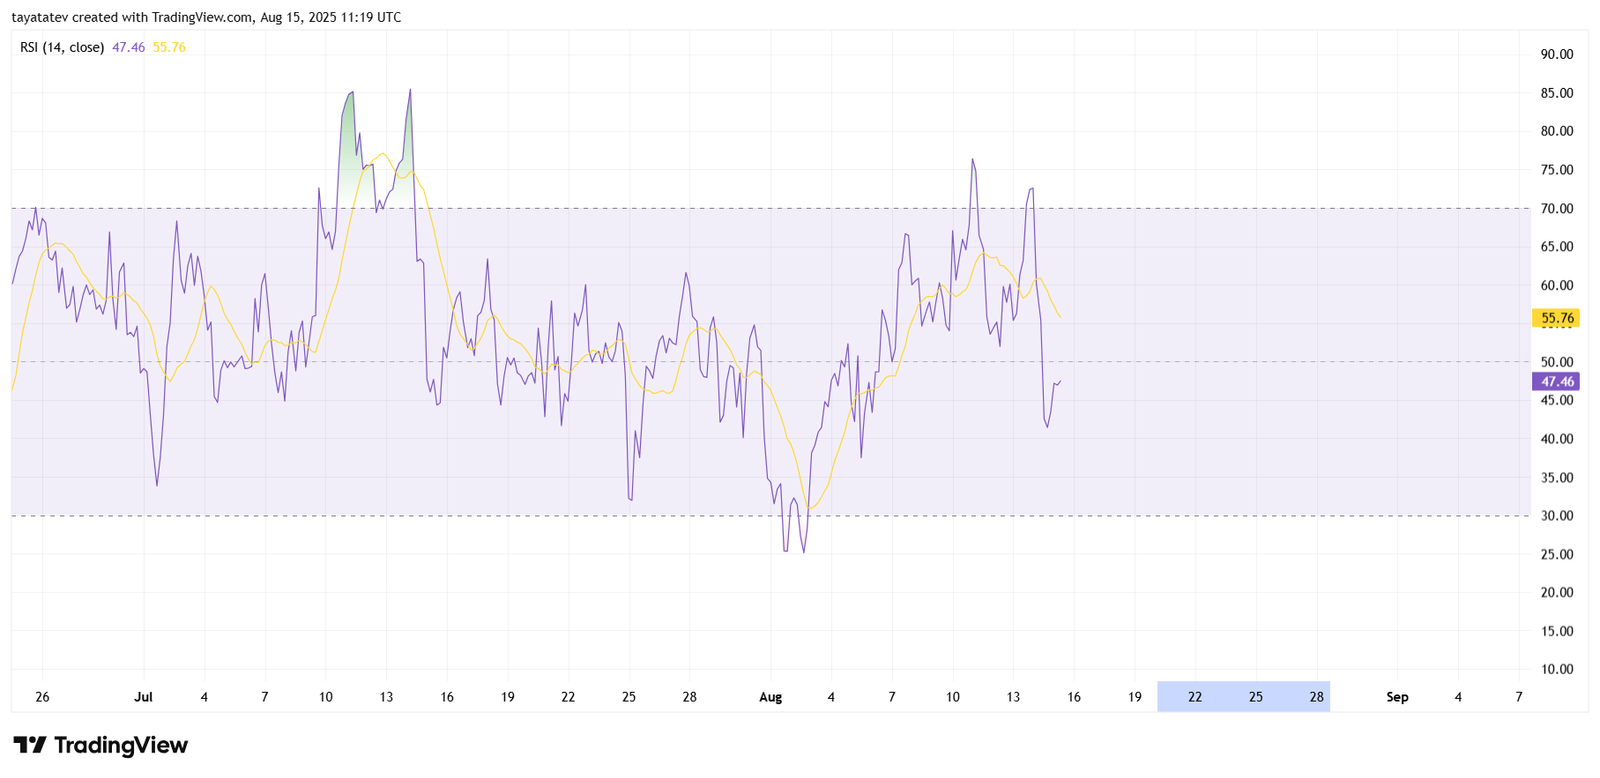
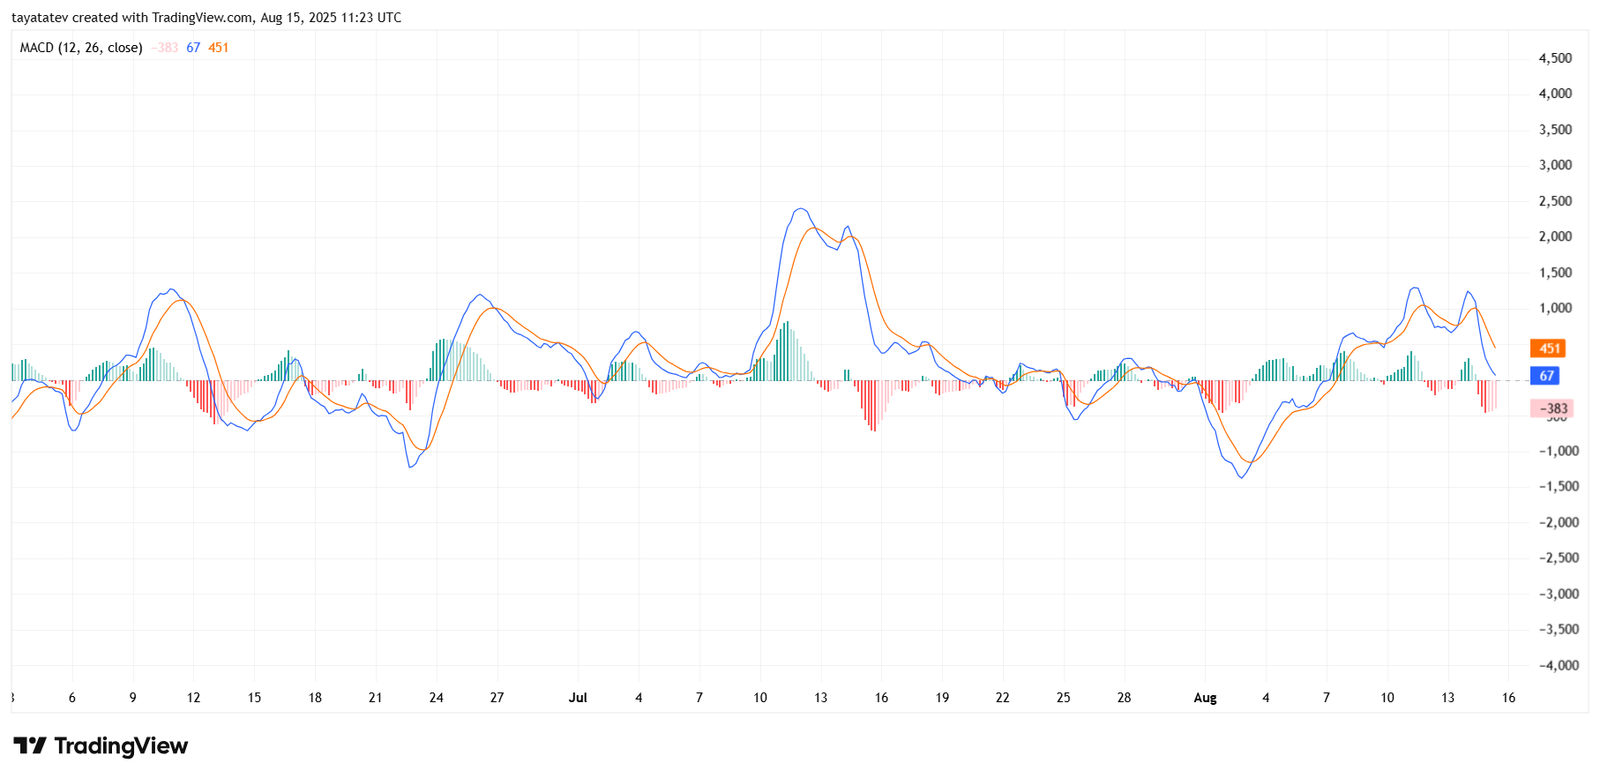
Bitcoin ascending triangle on August 15 suggests a confirmed break could lift price seventeen percent to 139,312 USD
The chart prints an ascending triangle, with rising swing lows and a horizontal cap near one hundred twenty five thousand to one hundred twenty six thousand USD. An ascending triangle is a continuation pattern where buyers push higher lows into a flat resistance, signaling pressure that can release upward after a confirmed breakout. Price trades around 119,070 USD on the chart, with the fifty period exponential moving average (EMA) near 118,829 USD providing dynamic support.
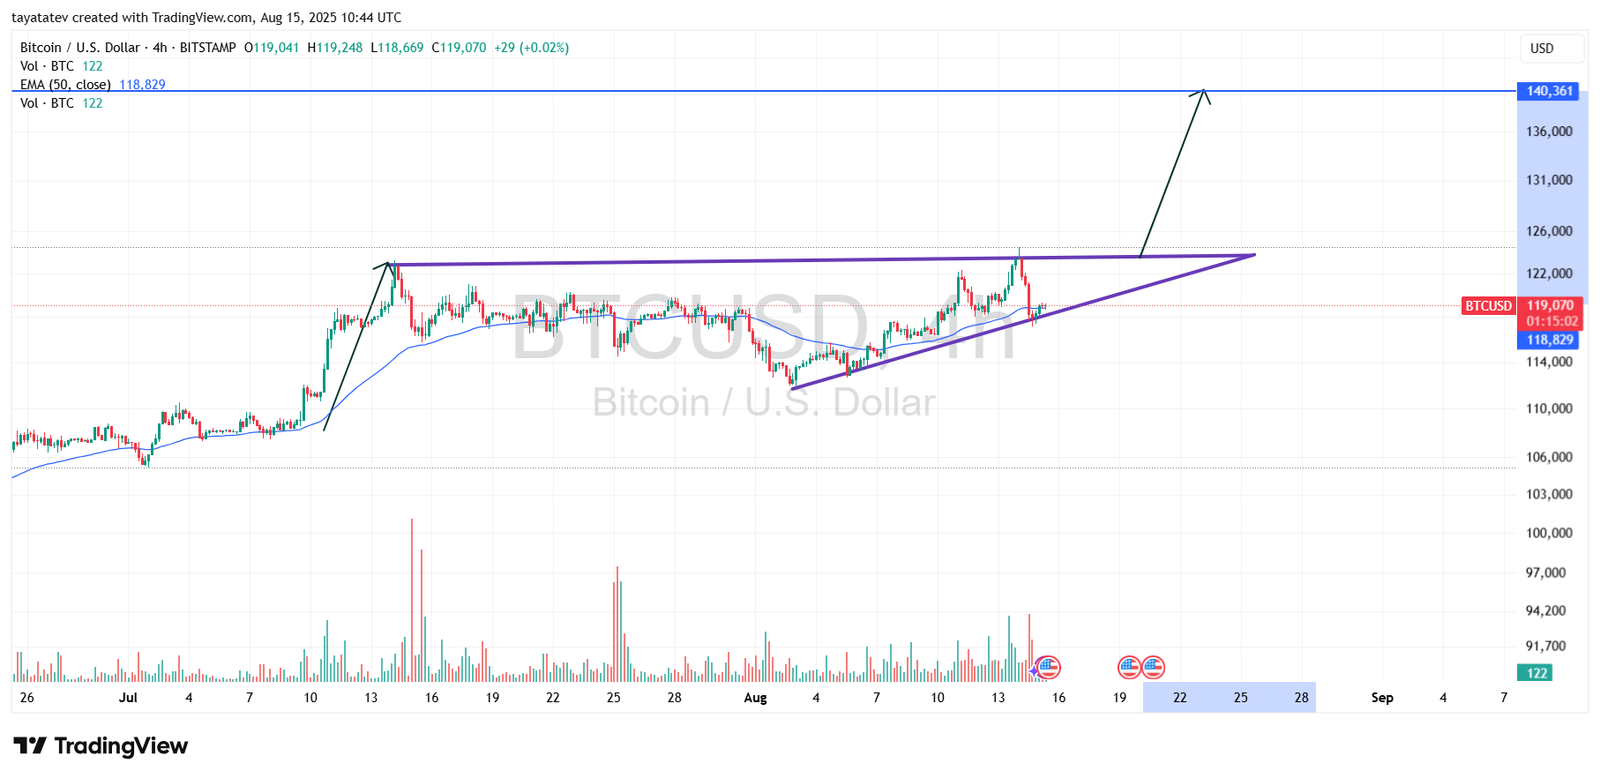
The structure shows a clean rising trendline from late July that now meets price around 118,800 to 119,000 USD. Meanwhile, repeated rejections cluster just below one hundred twenty six thousand USD, which marks the horizontal barrier drawn on the image. Volume spikes appear on thrusts into that ceiling, then cool during pullbacks, which often accompanies triangles as energy builds. The EMA fifty tracks under price and keeps the series of higher lows intact, which helps define the bullish pressure.
If Bitcoin clears and closes above the horizontal cap with expanding volume on the four hour or the daily time frame, the triangle would be considered confirmed by classical chart rules. Using the user requested measurement, a confirmation would imply a seventeen percent advance from the current chart price of 119,070 USD toward approximately 139,312 USD. That destination sits close to the drawn extension line around 140,361 USD, which the chart marks as a potential objective area. Until a decisive close arrives, the market remains inside the pattern, and price can continue to coil between the rising trendline and the ceiling.
Support sits first at the rising trendline and the EMA fifty around 118,829 USD. Holding that zone keeps the sequence of higher lows visible and preserves the triangle’s shape. A firm rejection from resistance without follow through could send price back to retest that average and the trendline. However, each return to the ceiling since early August has formed on higher lows, which keeps pressure pointed at the resistance band near one hundred twenty five thousand to one hundred twenty six thousand USD and sets the stage for a validation attempt.