XDC Network extended its reach on August 18 by integrating with LayerZero, enabling interoperability with more than 130 blockchains. The upgrade allows cross-chain real-world asset settlements and decentralized finance activity through the omnichain fungible token standard. The move positions XDC to play a wider role in asset transfers across multiple blockchain ecosystems.
Earlier in August, fitness application VitalVEDA launched on the XDC Network. The platform uses artificial intelligence to tailor workouts and introduces tokenized rewards for users who complete activities. By entering consumer-oriented sectors, XDC is expanding its use beyond finance into applications linked to everyday behavior.
On August 1, BigWater, a project centered on climate-related asset tokenization, began trading on the BitMart exchange. The token is built on XDC and connects blockchain infrastructure with sustainability initiatives. Its listing reflects a push to broaden XDC-based projects into environmental sectors.
Institutional Momentum Builds
The XDC Weekly report for August 10 to 16 highlighted several institutional and ecosystem developments. Co-founder Ritesh Kakkad joined a fireside chat in New York to discuss blockchain regulation and real-world asset adoption. At the same time, 21Shares launched an exchange-traded product tied to the XDC Network, giving accredited investors direct exposure through a regulated instrument.
The same week, the XDC MENA Podcast featured a discussion on real estate tokenization. Speakers described how blockchain could simplify property access for global investors. The update added to a growing list of XDC-related use cases that stretch from finance to consumer technology.
XDC Price Action Analysis
The four-hour chart of XDC/USDT from TradingView dated August 23, 2025 (16:35 UTC) shows a shift in market momentum.
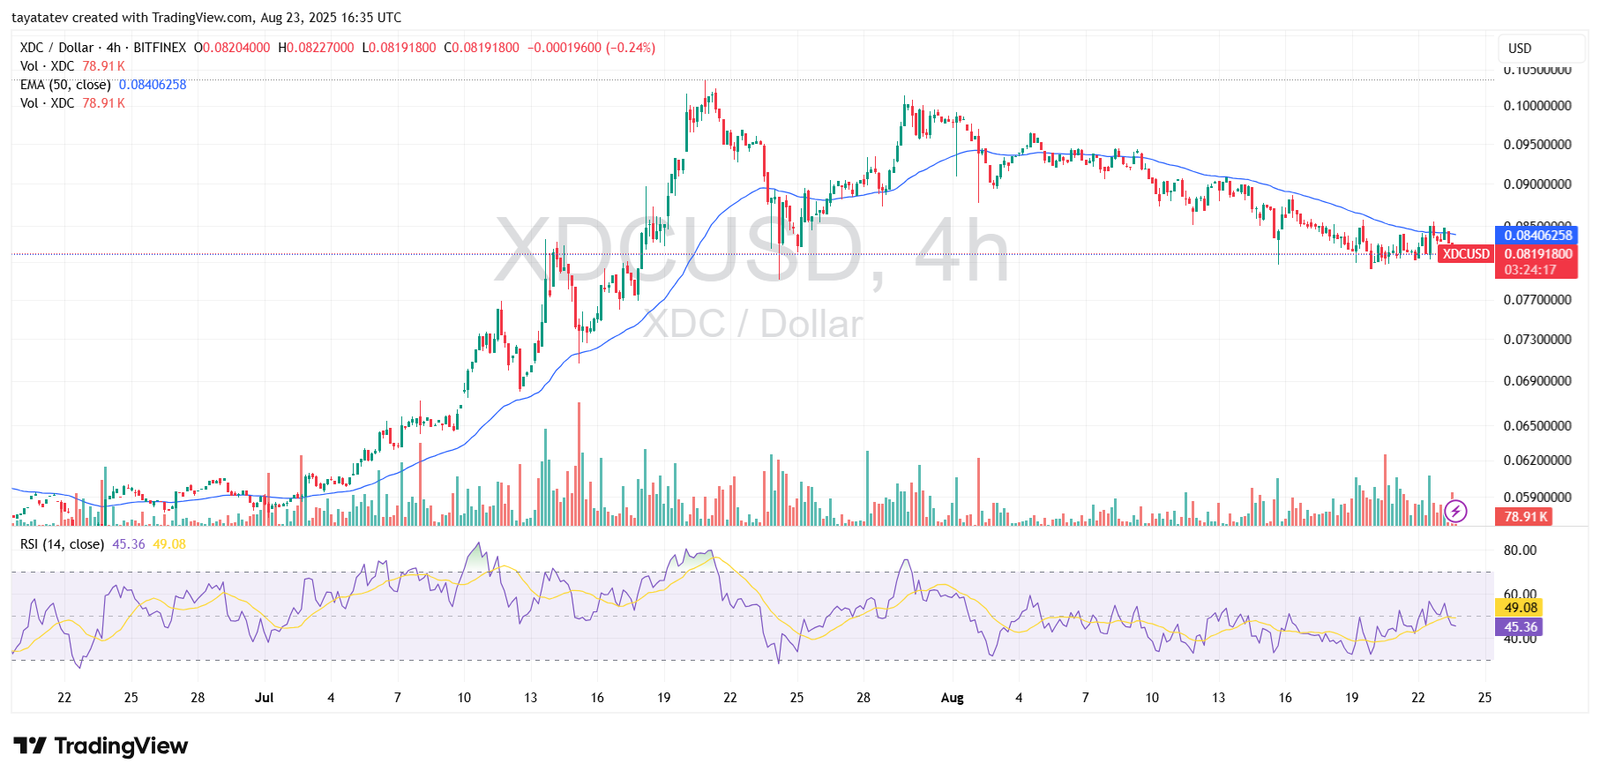
In July, XDC experienced a strong rally that pushed the price above $0.10. The surge coincided with expanding volume, confirming strong buying pressure. However, the momentum weakened near the peak, and sellers gradually took control. By late July, the chart displayed lower highs, signaling the beginning of a corrective phase.
Throughout early August, XDC consolidated but failed to sustain gains above $0.095. The price then slipped below the 50-period EMA, a level marked in blue on the chart, turning it into resistance. Since then, XDC has trended downward, losing nearly 20% from its local peak.
At the time of the chart, XDC trades around $0.0819, just under the EMA at $0.0840. The Relative Strength Index (RSI) hovers near 45, indicating slightly bearish momentum but not oversold conditions. Trading volumes remain subdued compared with the July peak, reflecting reduced market participation.
Going forward, XDC must reclaim the $0.084–$0.085 range to regain short-term bullish momentum. If it fails, the next support zones appear near $0.078 and $0.074. On the upside, a clean break above the EMA could open room back toward $0.090, where stronger resistance awaits.
Would you like me to also project a measured-move target using the July top-to-August range breakdown? That could give a clearer picture of possible downside or upside levels.
XDC MACD Analysis – August 23, 2025
The chart from TradingView (XDCUSD, 4h, dated August 23, 2025 displays the Moving Average Convergence Divergence (MACD) indicator.
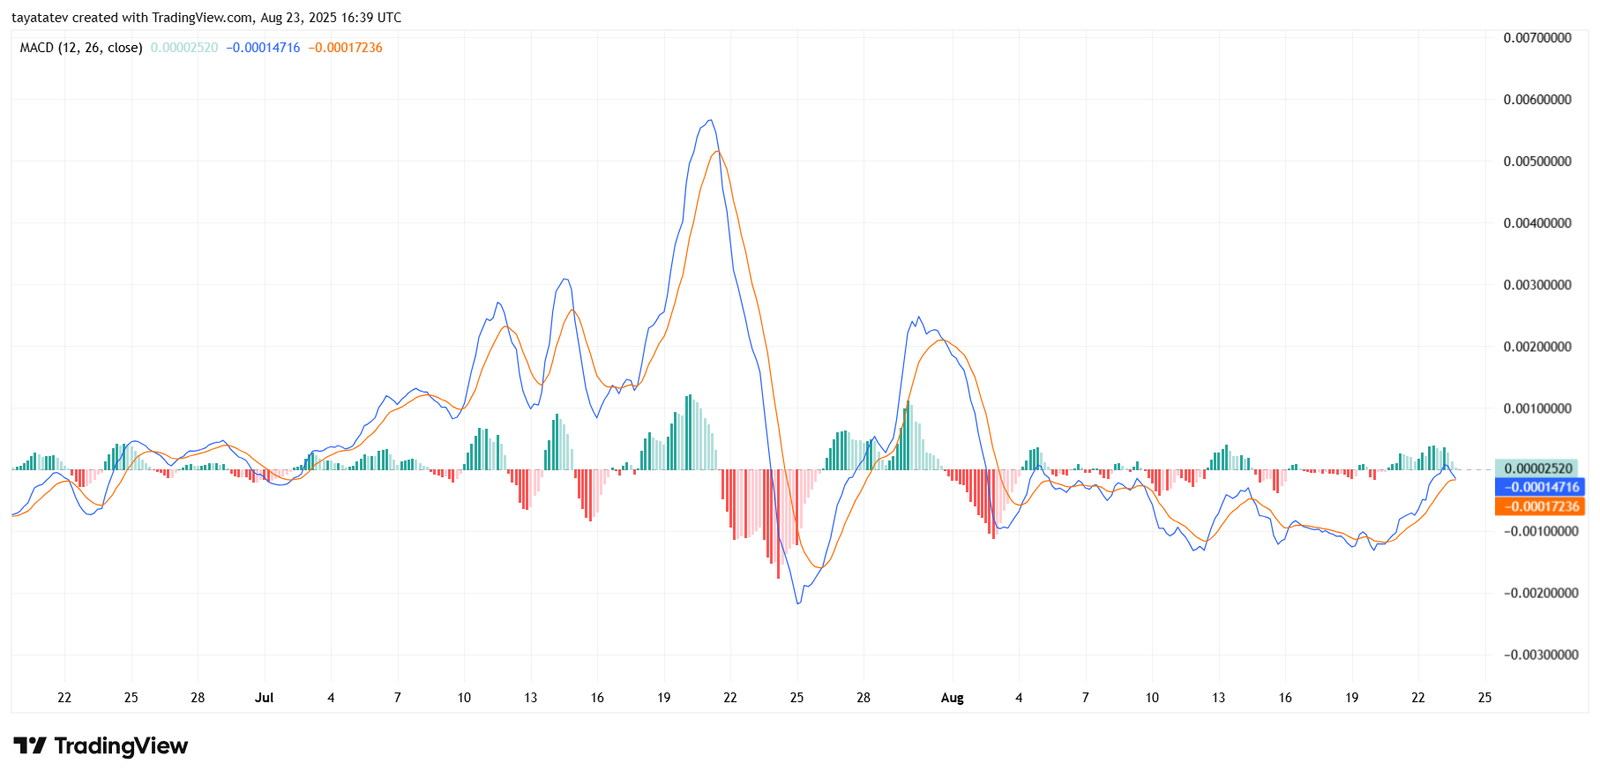
Through July, the MACD line (blue) remained above the signal line (orange), confirming the strong bullish momentum that drove XDC toward its July peak above $0.10. Each time the MACD expanded sharply higher, it aligned with aggressive upward price movement.
However, in late July, the MACD flipped into negative territory as the signal line crossed above. The red histogram bars deepened, showing strong bearish momentum. This period coincided with XDC’s drop from its highs, confirming the reversal.
In early August, attempts at recovery were brief. The MACD produced small green histograms, but momentum quickly faded, and both lines flattened near the zero axis. This flattening reflects reduced volatility and indecision among traders.
Currently, the MACD line is barely above the signal line, with the histogram showing small positive bars. This suggests weak bullish attempts but no strong confirmation of a trend reversal yet. If momentum strengthens, the next bullish crossover could support a move back above resistance near $0.085. If not, XDC risks sliding further, with bearish momentum resuming below $0.080.
XDC DMI Analysis – August 23, 2025
The chart from TradingView (XDCUSD, 4h, dated August 23, 2025 shows the Directional Movement Index (DMI). This indicator tracks the balance between bullish and bearish strength.
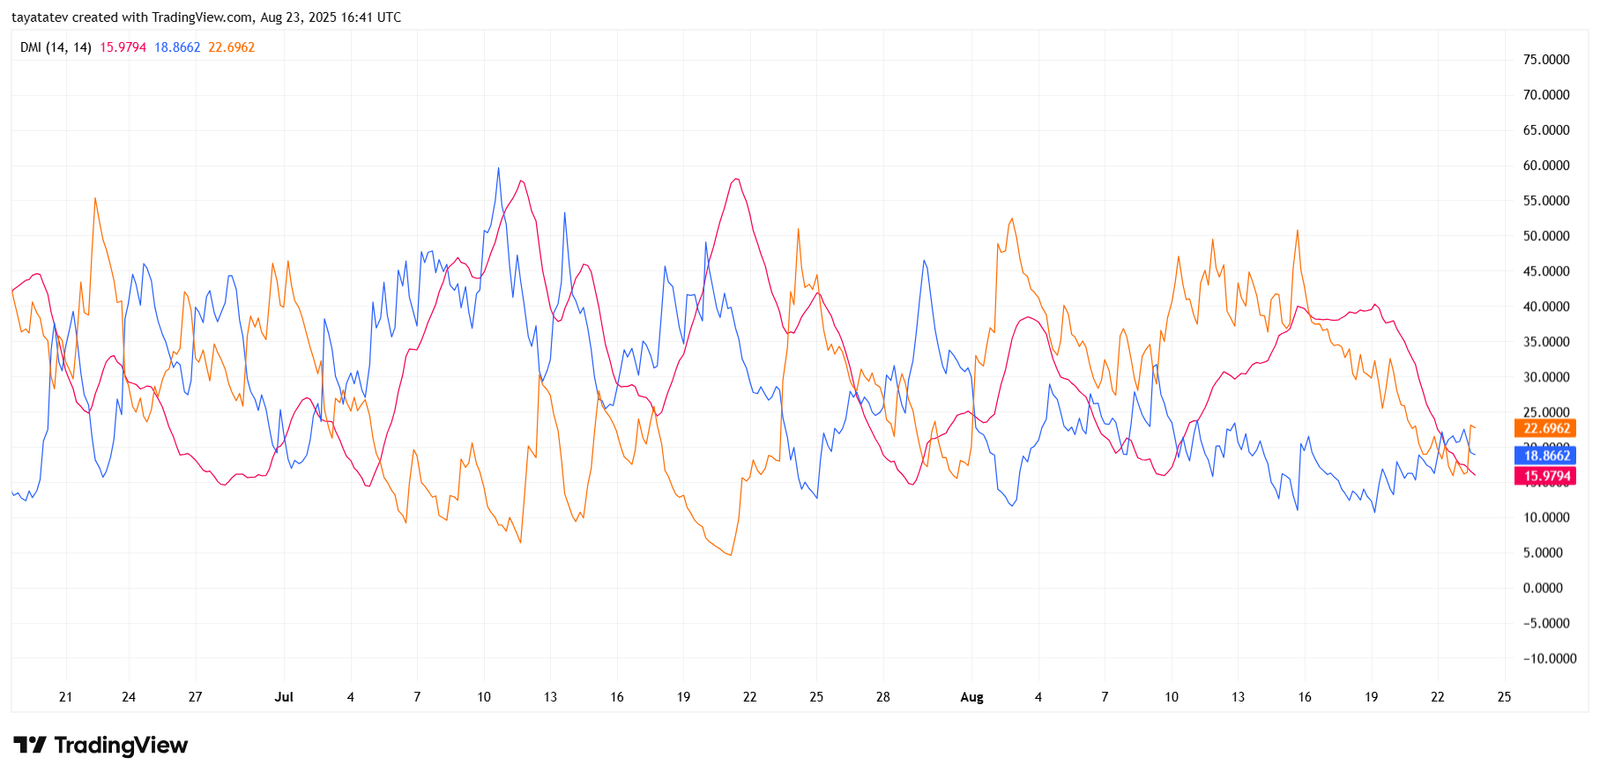
The +DI (orange line) represents bullish momentum, while the –DI (blue line) tracks bearish pressure. The ADX (pink line) measures overall trend strength.
During July, the +DI stayed well above the –DI, confirming strong buying pressure and aligning with XDC’s rally toward its peak. At the same time, ADX values climbed, signaling that the bullish trend was strong and sustained.
However, in late July, momentum shifted. The –DI crossed above the +DI as sellers took control, and ADX remained elevated, confirming that bearish pressure had become dominant. This crossover aligned with the decline that pulled XDC below $0.09.
Through early August, the +DI and –DI frequently crossed each other, reflecting indecision and weaker trends. ADX dropped, showing reduced momentum in either direction. This period matched the sideways trading and lack of follow-through on rebounds.
At present, the –DI (18.86) is slightly below the +DI (22.69), suggesting mild bullish pressure. However, the ADX value (15.97) is low, which indicates that the current move lacks strong conviction. This points to a weak trend environment where prices may continue consolidating unless momentum strengthens.
If ADX rises above 25 with +DI staying above –DI, it would confirm a new bullish trend. Otherwise, another bearish reversal could follow, especially if the –DI regains dominance near the $0.080 support zone.
