Solana’s decentralized finance ecosystem is preparing for a series of major token unlocks expected in the final quarter of 2025. Projects such as Jupiter (JUP) and Kamino (KMNO) will release new supply into circulation, amounting to 1.78 percent and 6.81 percent of their respective tokens. Developers emphasized that all schedules are transparent and coded into public smart contracts. “No hidden unlocks—our contracts and schedules are public,” said Marsno’s chief executive.
The unlocks are expected to expand liquidity in Solana’s DeFi markets. Similar events in previous cycles have led to short-term volatility, but projects have historically recovered as buyback programs and institutional inflows offset the selling pressure. Market observers note that transparent communication could help maintain confidence as these milestones approach.
Academic Study Exposes Phishing Risks
At the same time, Solana’s broader ecosystem is under scrutiny from cybersecurity researchers. A new academic paper introduces SolPhishHunter, a system designed to detect and classify phishing attempts that specifically target Solana’s architecture. The study identified more than 8,000 phishing incidents, providing the first dedicated dataset for Solana-based scams.
Researchers highlighted that Solana’s unique account structure and transaction design create distinct attack surfaces compared with other blockchains. By cataloging these threats, SolPhishHunter aims to support exchanges, wallets, and developers in strengthening their defenses. The study underscores the growing importance of cybersecurity as Solana’s user base expands.
The combination of transparent token unlock schedules and heightened security awareness is reinforcing trust in Solana’s infrastructure. Developers are positioning their projects for long-term adoption, while researchers are addressing risks that could undermine user confidence. Together, these developments signal that Solana’s ecosystem is maturing beyond rapid growth into a phase where institutional and retail users demand reliability and security.
Solana Chart Builds Ascending Triangle With 38% Upside Potential
The Solana SOL/USDT four-hour chart from TradingView, created on August 25, 2025, shows the formation of an ascending triangle pattern. An ascending triangle develops when the price consistently forms higher lows while testing a horizontal resistance level. This pattern signals that buyers are becoming more aggressive, compressing sellers near resistance until a breakout occurs.
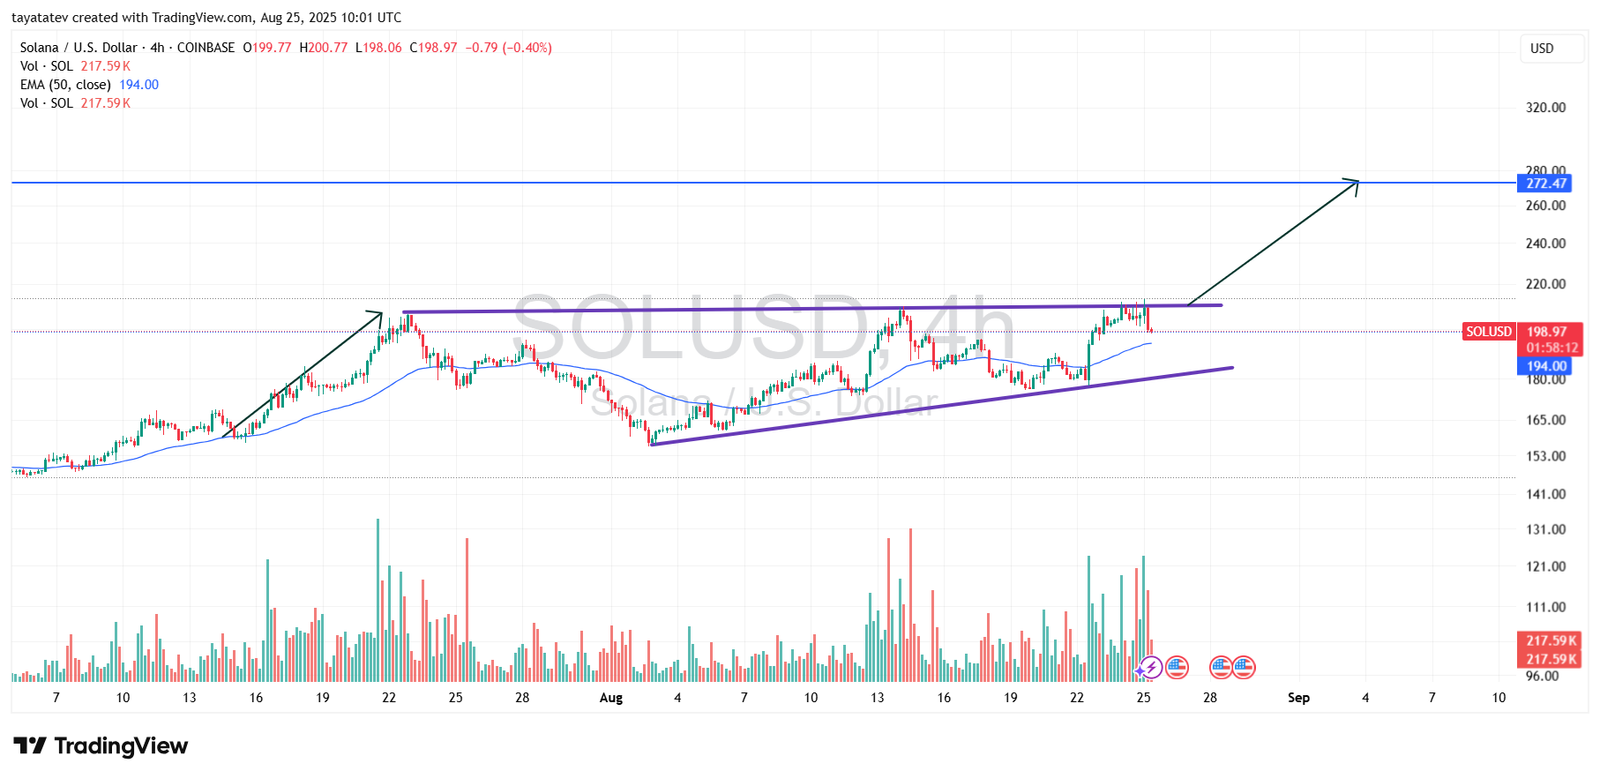
At present, Solana trades at 198.97 United States dollars, holding above the 50-period exponential moving average at 194.00 United States dollars. The resistance area is defined near 200 United States dollars, while the rising trendline has provided steady support since early August. The ascending triangle suggests building momentum for a decisive breakout once resistance is overcome.
If the breakout confirms, the pattern’s measured move projects a gain of roughly 38 percent, lifting Solana toward 272.47 United States dollars. This target is calculated by adding the height of the triangle base to the breakout level. The volume profile adds weight to this scenario, as rising buying activity has accompanied recent retests of resistance.
The broader market structure highlights sustained demand for Solana despite periods of consolidation. The token continues to form higher lows, reinforcing bullish bias. However, the confirmation of this pattern requires a strong close above resistance with expanding volume. Without that validation, Solana could extend its consolidation phase before attempting another breakout.
Solana MACD Points to Cooling Momentum but Watch for Reversal
The Solana four-hour chart from TradingView, created on August 25, 2025, shows the Moving Average Convergence Divergence (MACD) indicator signaling waning bullish momentum. The MACD line stands at 4.01, while the signal line is slightly higher at 4.86, placing the histogram in negative territory at –0.86.
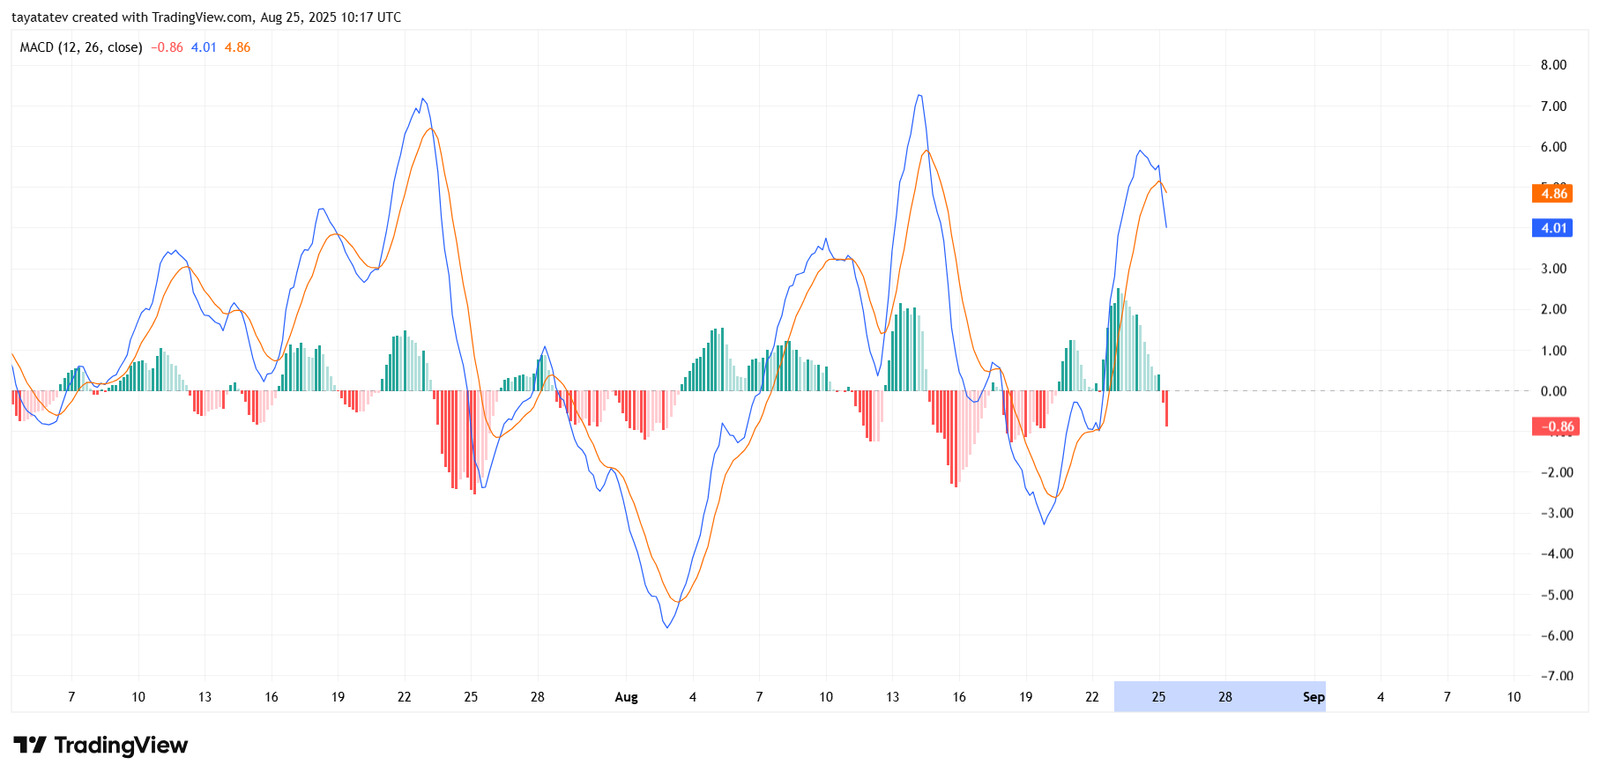
The MACD compares short-term and long-term moving averages to track changes in momentum. When the MACD line crosses below the signal line, it often signals that bullish pressure is fading. This crossover occurred after Solana’s recent rally attempt, suggesting a pause in upward momentum. The histogram’s shift into red confirms that sellers are gaining traction in the near term.
However, the broader MACD structure shows that each pullback since July has been followed by renewed buying pressure. The indicator repeatedly reset into negative territory before bouncing higher as Solana continued to form ascending patterns on the price chart. If the MACD line stabilizes and turns upward again, it could align with the ascending triangle pattern seen on the four-hour chart, supporting a breakout scenario toward higher ranges.
At this stage, the MACD highlights short-term cooling but not a breakdown. The divergence between the lines is still modest, leaving open the potential for a quick reversal if demand strengthens. Traders will watch closely for a bullish crossover, which would reinforce Solana’s technical case for a move toward the projected 272.47 United States dollars target.
Solana RSI Signals Neutral Momentum After Sharp Swing
The Solana four-hour chart from TradingView, created on August 25, 2025, shows the Relative Strength Index (RSI) at 48.12, with its moving average at 63.66. The RSI tracks the velocity of price changes and highlights overbought conditions above 70 and oversold conditions below 30.
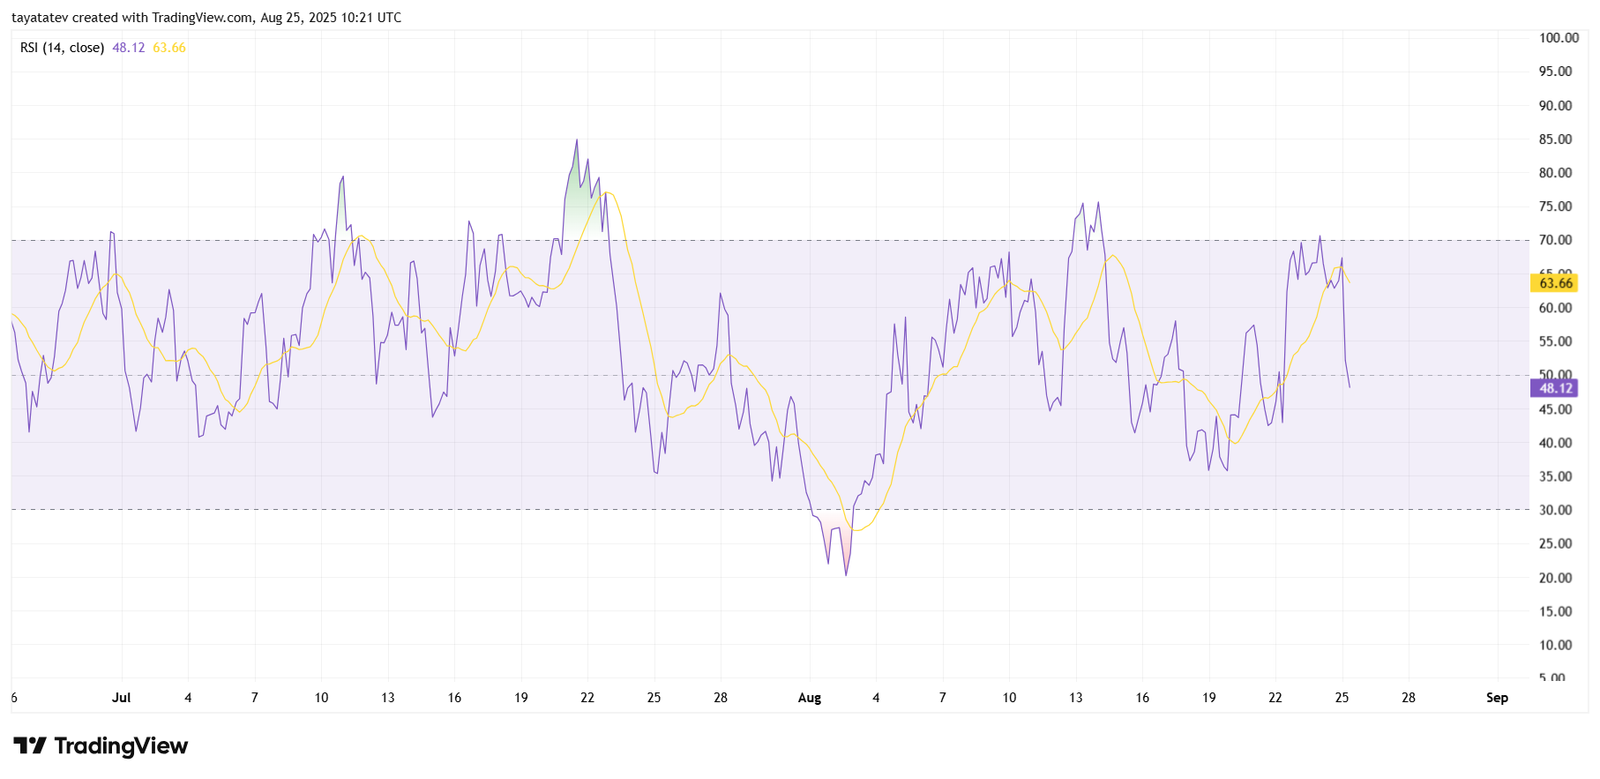
At present, Solana sits in a neutral zone, indicating that neither buying nor selling pressure dominates. The index fell sharply from the overbought territory reached earlier in August, when readings briefly pushed above 70, signaling that bullish momentum has cooled. The drop back toward the midline reflects a shift to consolidation rather than a breakdown.
The moving average above the RSI value signals mild bearish divergence, showing that sellers are temporarily stronger than buyers. However, the RSI has stabilized above the 40 level, keeping Solana out of oversold conditions. A rebound toward 55–60 would confirm renewed buying strength, while a sustained move below 40 would indicate rising downside risk.
Overall, the RSI reveals that Solana is in a holding phase after a strong rally earlier this month. This position leaves space for a recovery if the ascending triangle pattern seen on the price chart confirms with a breakout, but it also warns that momentum must return before the next upward leg can begin.
