
XRP/USDRipple and the U.S. Securities and Exchange Commission (SEC) have formally ended their long-running legal battle by dismissing outstanding appeals linked to the 2023 ruling. That decision confirmed that XRP sales on public exchanges do not qualify as securities transactions. The resolution removes a critical source of uncertainty and provides a legal framework that institutions can now reference with confidence.
Ripple Positions for Institutional Expansion
With regulatory clarity in place, Ripple is moving to expand XRP’s role in cross-border payments and enterprise use cases. The dismissal of appeals has allowed the company to focus on scaling its infrastructure and securing new banking and fintech partnerships. Market participants say that the ruling offers Ripple a rare level of stability in a sector often clouded by legal disputes.
Unconfirmed reports indicate that JPMorgan has begun accumulating XRP in recent weeks. While the bank has not issued a public statement, analysts suggest the move could signal a broader institutional shift toward the token. The timing coincides with several pending applications for spot XRP exchange-traded funds under SEC review, raising expectations of further regulated access to the asset.

The conclusion of Ripple’s case with the SEC is being framed as a watershed moment for the digital asset industry. Observers note that XRP’s regulatory standing may serve as a model for other tokens navigating U.S. securities law. The post-SEC era has positioned XRP as a benchmark in the debate over how digital assets fit into traditional finance, highlighting its potential to bridge regulatory standards with institutional adoption.
XRP Forms Bullish Pennant With Breakout Potential
The chart created on August 27, 2025, on the four-hour timeframe for XRP against the U.S. dollar XRP/USD shows the development of a bullish pennant pattern. A bullish pennant is a continuation pattern that appears after a strong upward move, where price consolidates between converging trendlines before a potential breakout in the same direction as the prior rally. In this case, XRP surged sharply in mid-July, and since then, price has compressed inside narrowing support and resistance lines, creating the pennant formation.
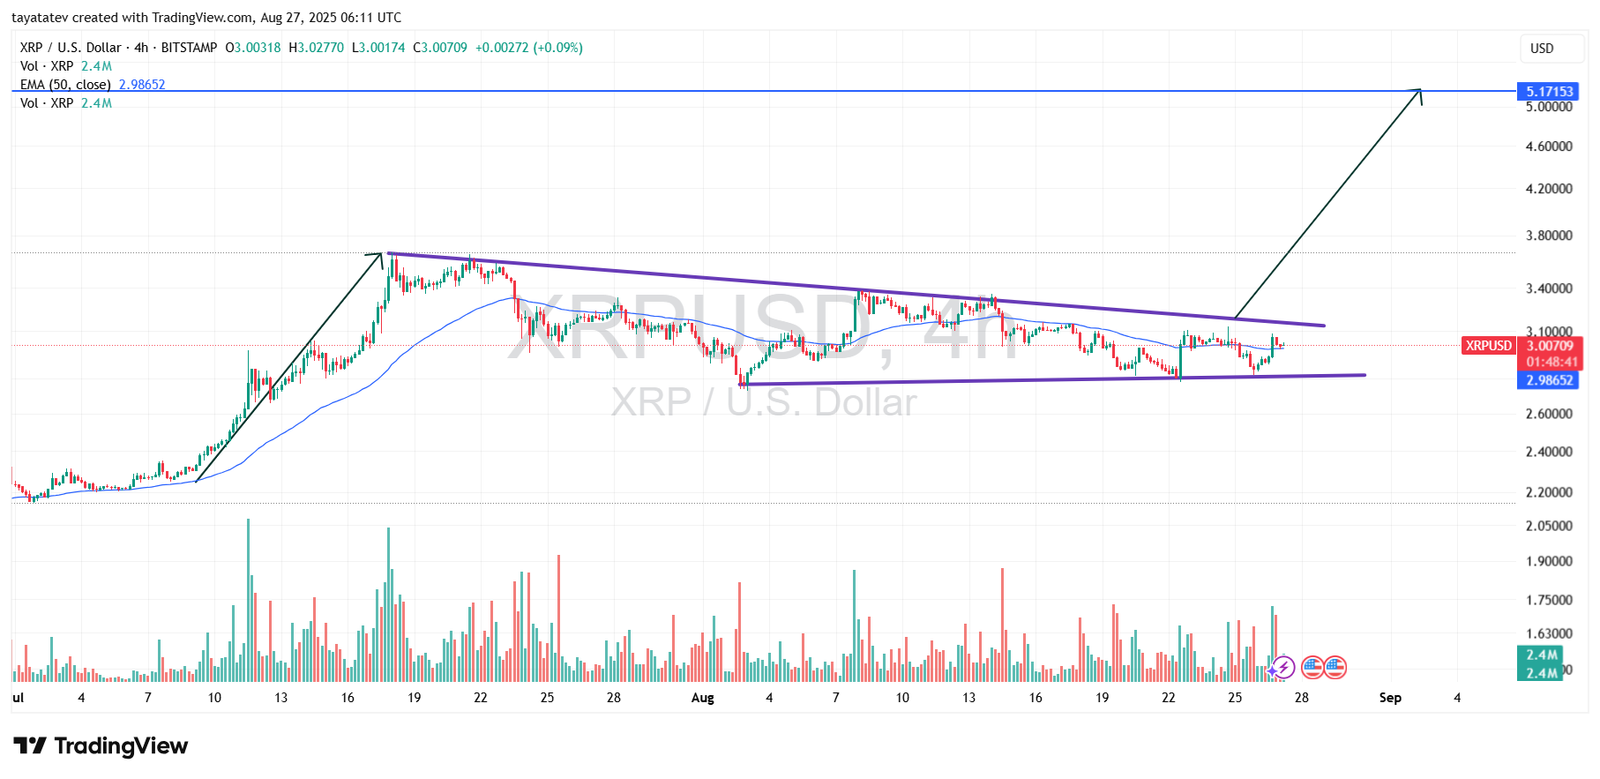
At the time of the chart, XRP trades around $3.00, while the 50-period exponential moving average (EMA) sits at $2.98. The EMA has flattened during the consolidation but continues to provide dynamic support, showing that buyers are defending the medium-term trend. Each time price dips toward the EMA, it finds support, reinforcing its role as a guiding line for momentum.
Volume analysis further strengthens the pennant structure. The chart shows that volume spiked heavily during the initial rally into the pattern, which is characteristic of a valid bullish pennant. Following that surge, volume decreased steadily as price moved sideways and tightened between the two purple trendlines. This drop in activity is expected, as pennants typically form during cooling phases before the next breakout wave. For confirmation, traders will watch for another surge in volume accompanying a breakout above resistance.
If the bullish pennant confirms, the measured move from the prior rally projects a potential 72 percent upside. From the current level near $3.00, this would lift XRP toward the $5.17 target. The projection aligns with the breakout calculation, where the height of the initial rally is added to the breakout point of the pennant. This makes the $5.17 zone the next significant target once buyers reclaim control and push beyond the upper boundary.
In summary, XRP has created a bullish pennant pattern supported by a flattening but steady EMA and by volume dynamics consistent with consolidation. If the breakout comes with renewed volume, the path toward a 72 percent rally to $5.17 becomes realistic. Until then, the pennant remains in play, with both traders and institutions watching for decisive confirmation.
XRP RSI Points to Building Momentum
The chart created on August 27, 2025, shows the Relative Strength Index (RSI) for XRP on the four-hour timeframe. The RSI, calculated on a 14-period close, currently stands at 54.57, with its moving average line at 46.70. The indicator has spent the past two months oscillating between the traditional overbought threshold near 70 and the oversold threshold near 30. At present, XRP has pushed back above the 50 midpoint, suggesting a tilt toward improving momentum after a period of weakness.

In July, RSI spiked sharply above 70. This move placed XRP in overbought territory. The surge confirmed strong buying activity at the time. After that rally, the market began to consolidate. During late July and much of August, RSI created lower highs. The indicator even slipped below 30 during local corrections. That dip showed heavy selling pressure. It also marked a loss of buyer control. Each time RSI approached oversold levels, buyers stepped back in. Their response prevented a deeper breakdown.
Now RSI has crossed back above the 50 midpoint. This shift signals the first signs of renewed momentum. The RSI moving average at 46.70 is also turning higher. The slope upward confirms recovering buying activity. If RSI keeps rising into the 60–70 range, bulls will regain clear control. A failure to hold above 50 would show hesitation. Sellers could then attempt to pull the market lower again.
At this stage, RSI points toward improving sentiment. The indicator shows a build-up of possible bullish pressure. It also aligns with XRP’s bullish pennant pattern on the price chart. As long as RSI holds above the midpoint, the chance of an upside breakout remains strong.
XRP MACD Signals Momentum Recovery
The chart created on August 27, 2025, shows the Moving Average Convergence Divergence (MACD) for XRP on the four-hour timeframe. The MACD line is at 0.00897, the signal line is at 0.00245, and the histogram is printing positive values near 0.0065. This setup indicates that bullish momentum is returning after a period of weakness.
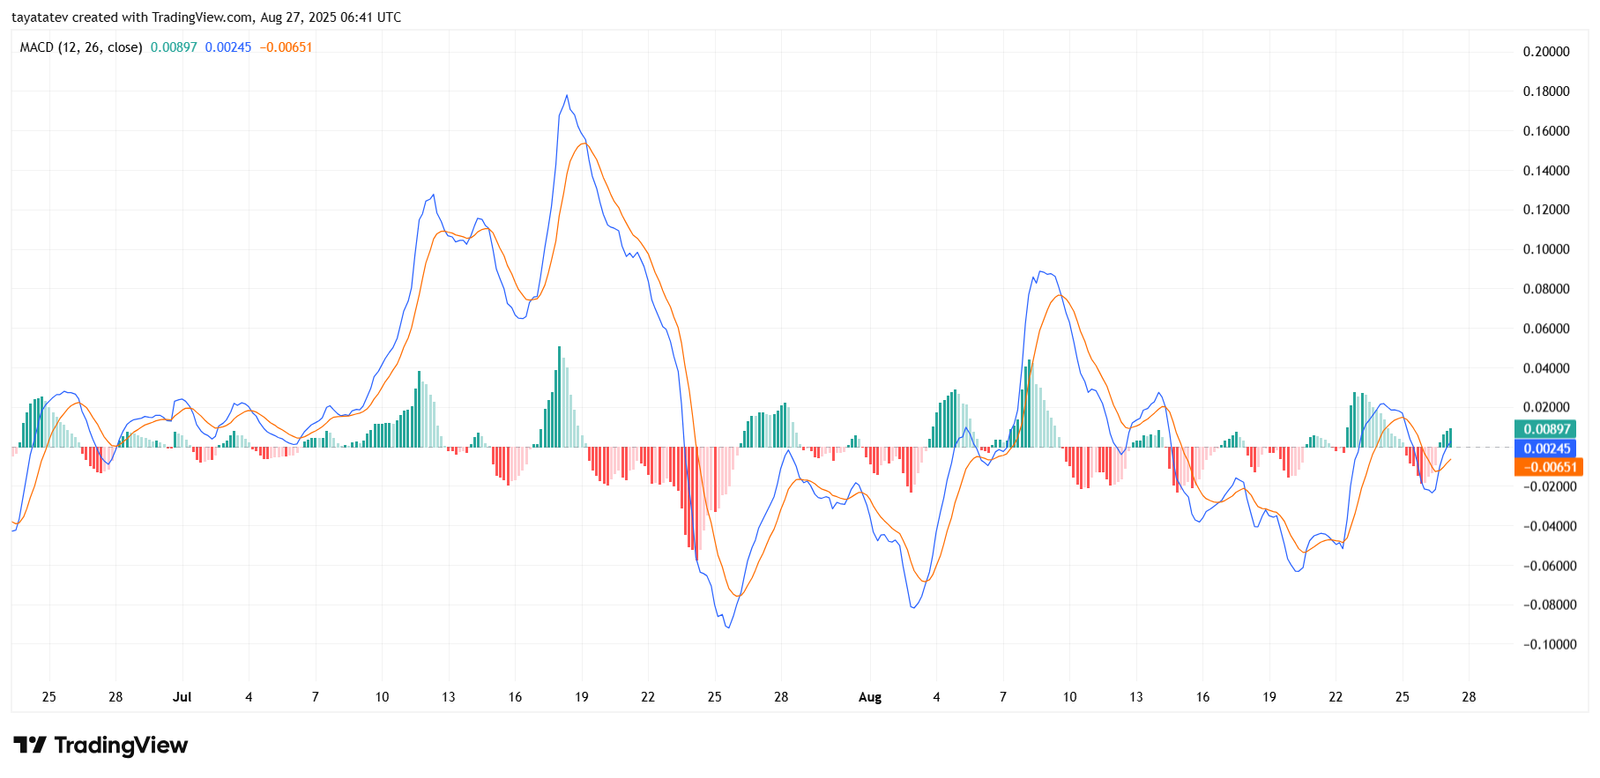
During July, the MACD line surged well above the signal line, with green histogram bars expanding sharply. That move confirmed strong bullish strength and matched the price rally toward $3.00. However, later in the month and into early August, the MACD fell below the signal line, and the histogram turned red. The deeper drop under the zero line reflected sustained selling pressure, which matched XRP’s consolidation phase.
In mid-August, the MACD again crossed into positive territory, showing a brief rebound. That bounce was followed by another dip, which pulled the indicator slightly below zero. Now, the MACD has turned upward once more, and the histogram has shifted back to green. The blue MACD line crossing above the orange signal line reinforces this change. Together, these signals suggest that buying pressure is slowly building again.
If the MACD continues to rise while the histogram bars expand further in the green zone, it would confirm a stronger bullish recovery. This development would align with XRP’s bullish pennant formation and RSI improvement above the midpoint. On the other hand, if the MACD loses momentum and falls back under the signal line, XRP could see another round of consolidation before attempting a breakout.
At this stage, the MACD reflects early signs of momentum recovery. The alignment of a positive crossover with green histogram bars points toward renewed buying activity, which supports the broader case for an upside move.
