
Catizen has launched Play 1.0, a Layer-2 blockchain built on The Open Network (TON). The new framework aims to make it easier for Web2 game developers to shift into blockchain gaming.
The platform reduces developer costs by replacing 30–40 percent fees with near-zero charges. In addition, it introduces NFT-based in-game assets and community-driven governance. Catizen said this move will expand its ecosystem and help onboard more traditional developers.
Airdrop Pass Paused After Manipulation Reports
On August 20, Catizen suspended its Airdrop Pass system. The decision followed allegations of point manipulation during Season 3.
The team confirmed that quarterly airdrops of 10 million CATI tokens will continue. However, future distributions will focus on “core ecosystem” players rather than passive participants. Catizen described the update as a shift toward rewarding genuine engagement within the platform.
Earlier this month, Catizen disclosed its mid-year growth data. The project now has 63.4 million registered users, including 3.6 million who joined directly from Web2 platforms.
In 2025, players have already consumed 50 million CATI tokens in gaming activities. Investor backing from Animoca Brands, announced in May, has also fueled expansion. The funding supported the release of new features, including a futures trading game called Cattea and a Web3 gaming API for developers.
Catizen (CATI) Bearish Pennant Analysis
A bearish pennant pattern is a continuation formation that signals a likely extension of an existing downtrend after a brief consolidation.
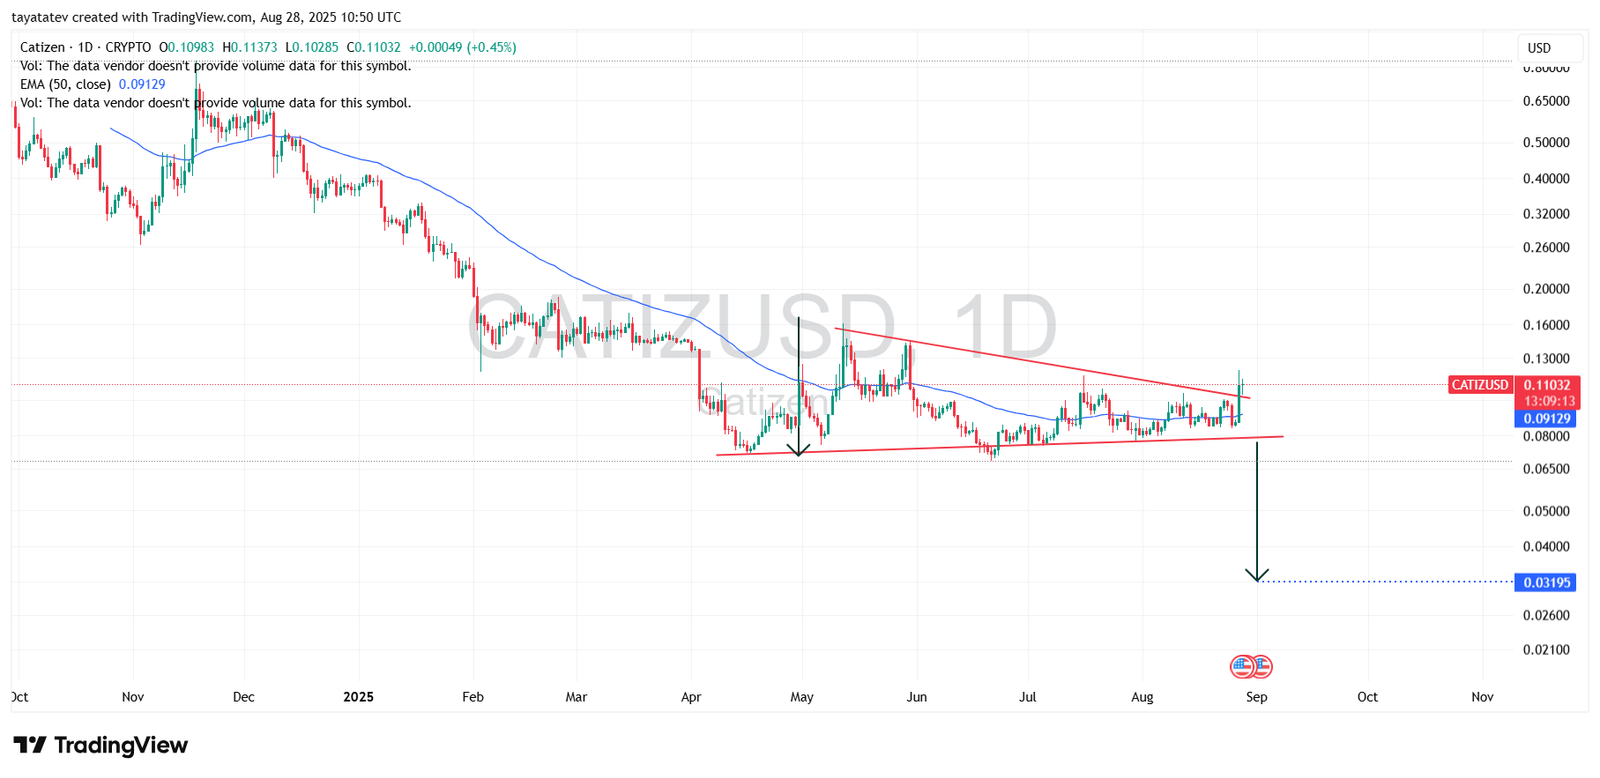
The Catizen CATI/USDT daily chart shows that price action formed this bearish pennant following its prolonged decline from late 2024 into early 2025. The consolidation zone has been defined by lower highs and relatively stable lows, forming the triangular pennant shape. The breakout direction is crucial in such patterns, and the chart highlights a potential downside projection.
Based on the measured move principle, the pennant’s height is taken from the prior sharp decline and then projected downward from the breakout point. This calculation indicates a possible target of around $0.0319, which represents a drop of nearly 238 percent from the current trading price of approximately $0.1103. Such a move would retest deep support levels not seen since the earliest trading phases of CATI.
However, for confirmation, traders usually require a decisive breakdown below the lower trendline of the pennant with increased momentum. At present, CATI is still holding slightly above this support, meaning the bearish outcome has not yet been fully validated. Until a breakdown closes below the support trendline, there remains the possibility of invalidation and further sideways trading.
Catizen (CATI) RSI Analysis
The chart shows the Relative Strength Index (RSI, 14-day) with its moving average. Currently, the RSI sits around 65.36, with its signal line at 52.65. This positioning indicates that CATI is approaching the overbought zone, which typically begins at 70.
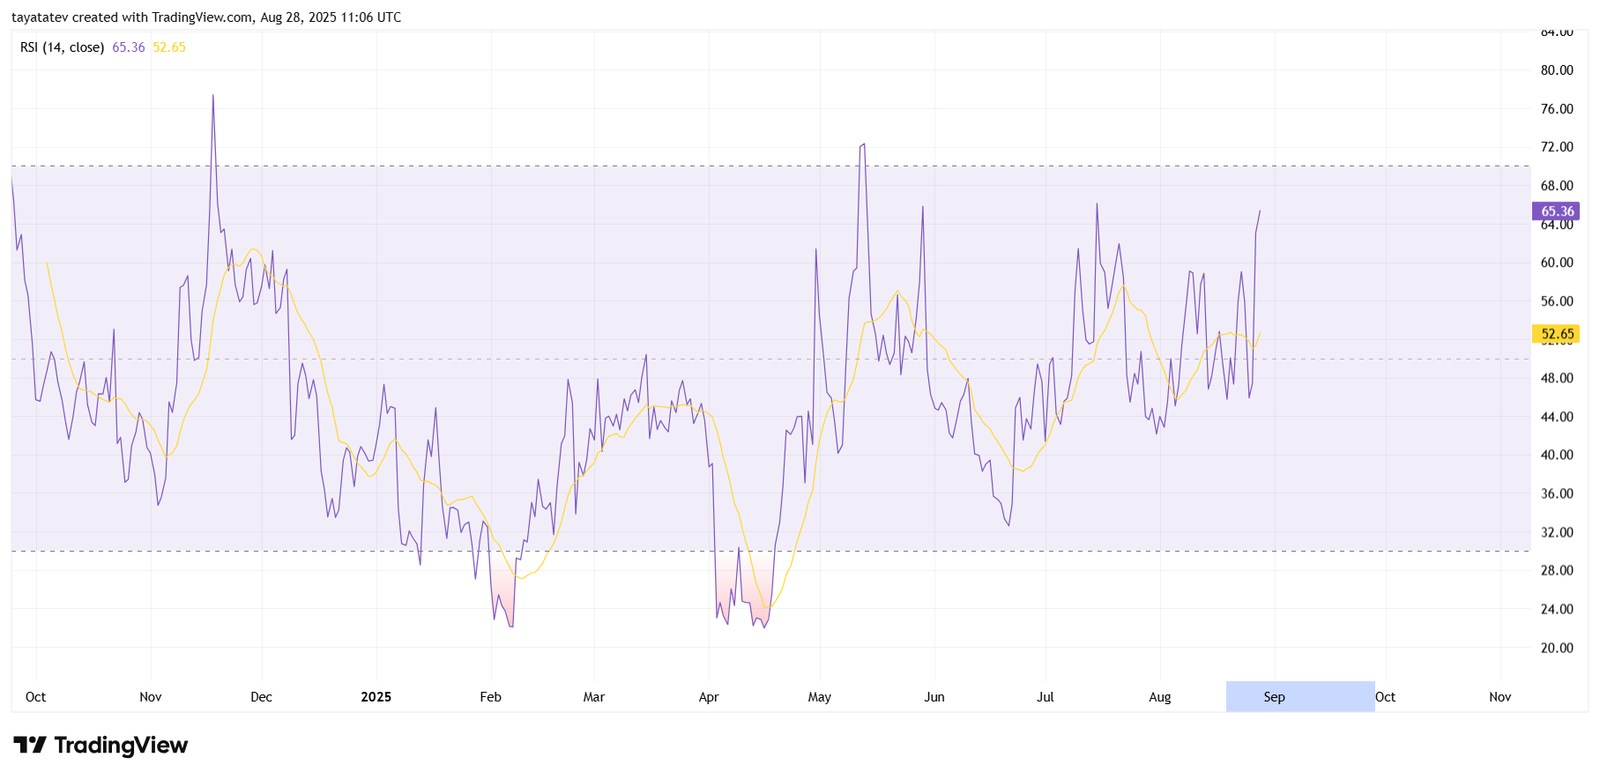
Throughout 2025, RSI has fluctuated sharply, often spiking above 70 and then pulling back quickly. These movements suggest strong but unsustained buying momentum, with repeated corrections following each surge. The present reading near 65 reflects bullish momentum building again after weeks of sideways trading. However, the distance between the RSI line and its moving average shows that momentum may be stretching, which often precedes short-term volatility.
If RSI breaks above 70, CATI could experience another rally, but history on this chart shows that overbought conditions quickly reversed into sharp pullbacks. On the other hand, if RSI fails to push higher and rolls back under the moving average, it would confirm weakening momentum and potentially align with the bearish pennant breakdown scenario discussed earlier.
Catizen (CATI) MACD Analysis
The chart shows the Moving Average Convergence Divergence (MACD) indicator with standard 12, 26, and 9 settings. Currently, the MACD line is at 0.00203, the signal line at 0.00151, and the histogram reflects positive momentum.
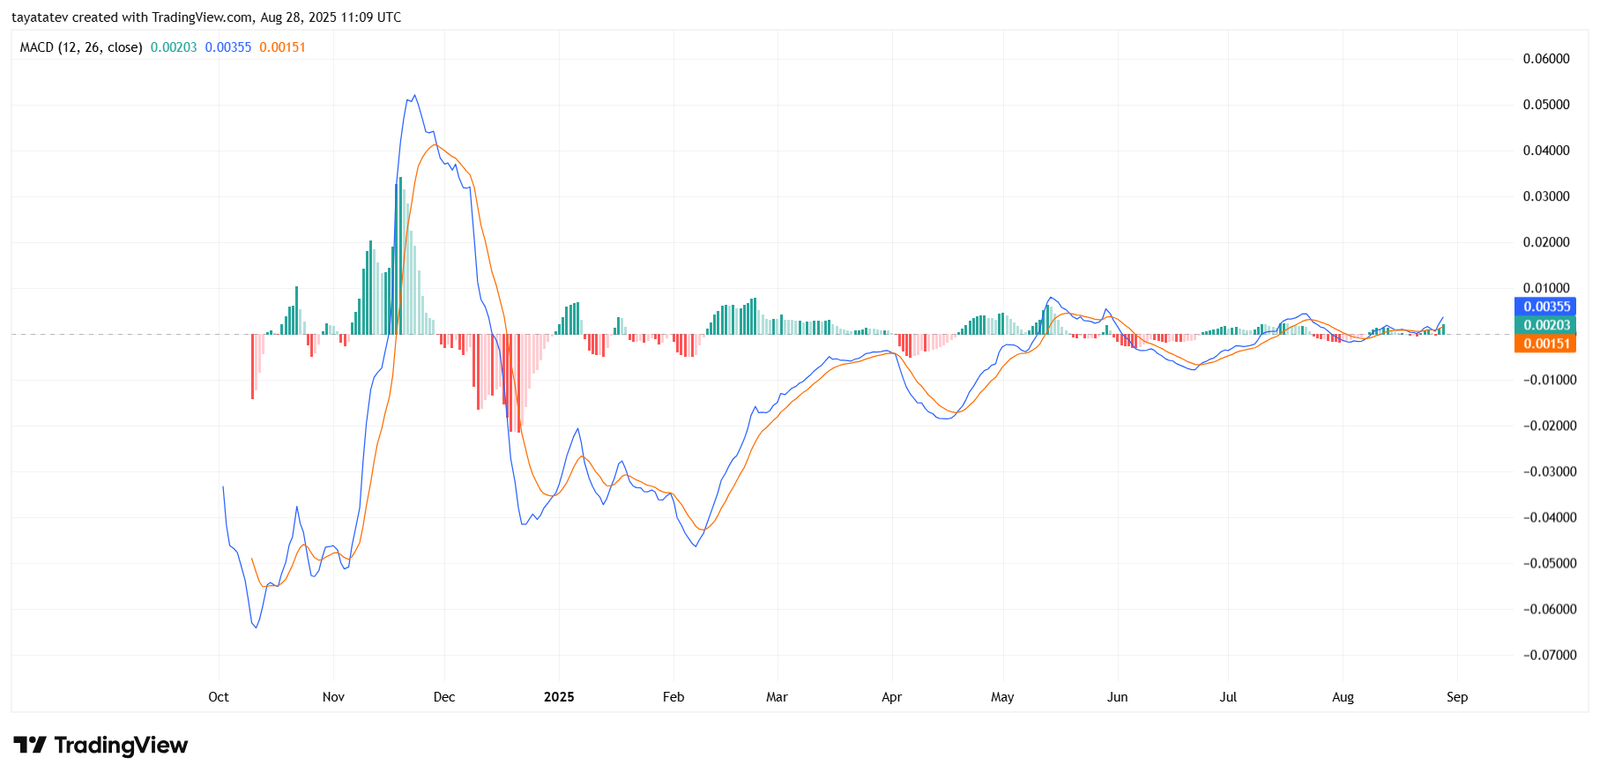
This crossover, with the MACD line moving above the signal line, suggests that short-term bullish momentum is building. The histogram turning green reinforces this view, indicating buyers are gaining strength after a long period of sideways activity. Historically, when CATI’s MACD showed similar crossovers, brief rallies followed. However, many of these rallies lost steam quickly, as seen in late 2024 and mid-2025, where positive signals reversed within weeks.
The current MACD levels remain close to the zero line, which signals that the broader trend is still weak and fragile. Unless momentum expands strongly, this move may represent only a temporary rebound within a larger bearish setup. When viewed alongside the bearish pennant pattern on the price chart, the MACD crossover could be interpreted as a short-term relief rally before potential continuation of the longer downtrend.
Catizen (CATI) Stochastic Momentum Index (SMI) Analysis
The chart displays the Stochastic Momentum Index (SMI, 10, 3, 3), which refines the traditional stochastic oscillator by measuring where the current close sits relative to the midpoint of the high-low range. At present, the SMI reading is 26.70, while its signal line is 11.95.
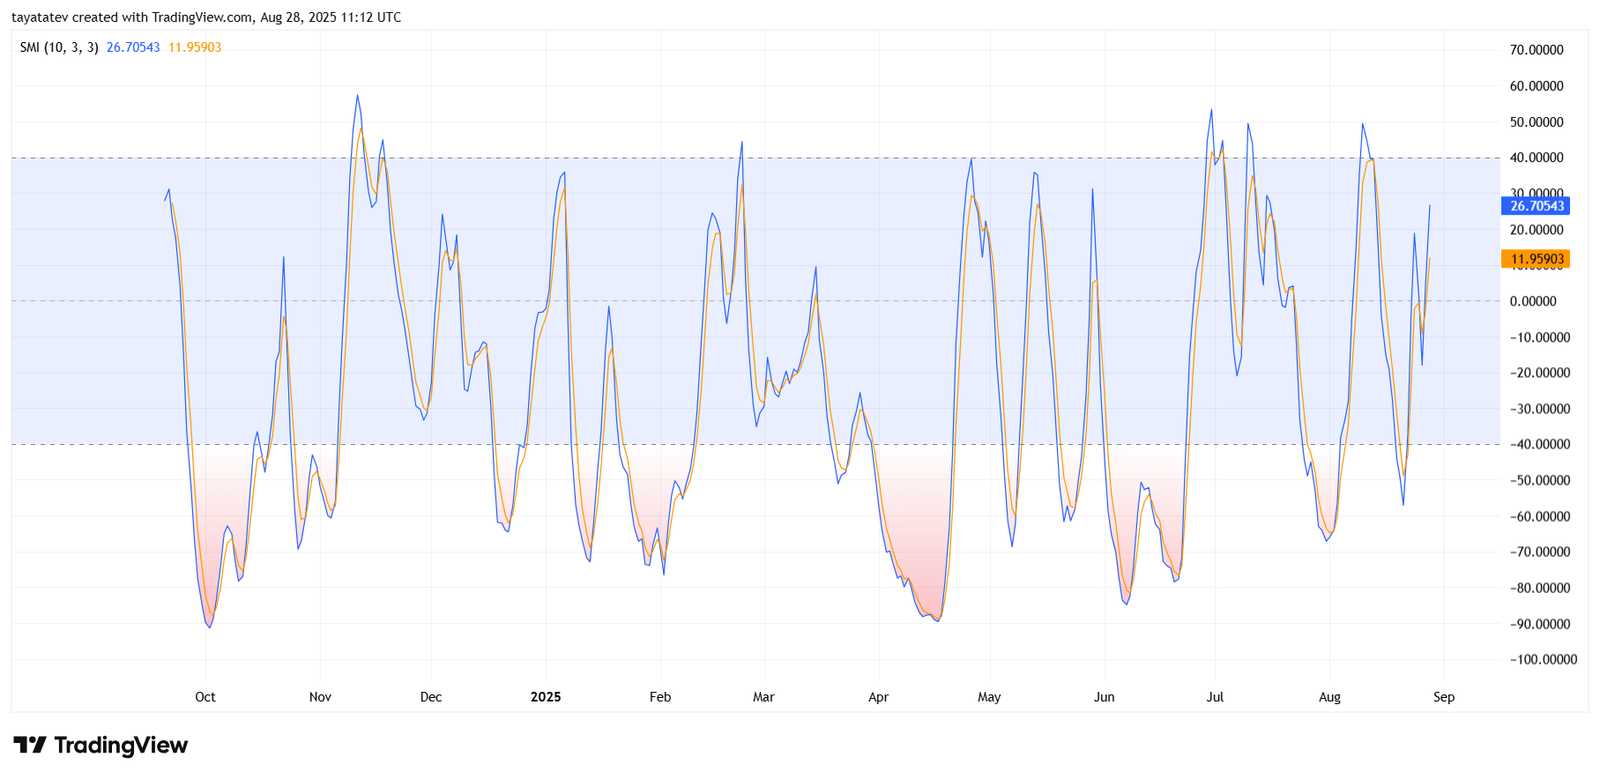
This positive crossover indicates that CATI has short-term upward momentum. The oscillator has lifted from negative territory and is now trending higher, suggesting renewed buyer interest after a period of weakness. Historically, when the SMI crossed above the signal line in this chart, it produced quick bursts of upside movement, though often short-lived.
Despite the bullish signal, the SMI remains far below the upper bound (around +70 to +100), which marks overbought conditions. This means there is still room for further upside before exhaustion signals appear. However, the SMI has been extremely volatile throughout 2025, with sharp reversals from both extremes. This volatility suggests traders should be cautious, as bullish crossovers have not always translated into sustainable rallies.
Overall, the current SMI pattern supports a short-term rebound scenario for CATI. Yet, given its alignment with a broader bearish pennant on the price chart, this indicator may only be showing a temporary recovery inside a larger bearish trend.
