
Grayscale has created a Delaware trust structure as part of preparations for a Cardano ETF. The move highlights growing institutional interest and reflects ongoing regulatory groundwork in the United States. Analysts note that the probability of approval for a Cardano ETF has climbed to 87%, with the Securities and Exchange Commission expected to issue a decision by October 26, 2025. An approval could mark a major step in expanding institutional exposure to Cardano.

Alongside the ETF efforts, Cardano’s ecosystem is advancing through technical and funding initiatives. The network is rolling out scalability upgrades, including Ouroboros Leios and Hydra. These upgrades are backed by a $71 million community fund, which is dedicated to supporting projects and accelerating adoption. Developers emphasize that these improvements aim to strengthen Cardano’s capacity to handle higher transaction volumes and more complex applications.
Cardano also faces new competition from emerging blockchain models. BlockDAG, a protocol using a disruptive presale approach, is presenting itself as an alternative to Ethereum and Cardano. In parallel, utility-focused projects such as Remittix are targeting real-world remittance use cases, signaling a broader market shift toward payment-focused platforms. These developments underline the pressure on Cardano to continue delivering both innovation and institutional credibility.
Cardano Faces Key Resistance at $0.88
Crypto analyst Ali Martinez stated that Cardano (ADA) must break above the $0.88 level to confirm the start of a rally. He shared the analysis on X, supported by a chart from TradingView, showing ADA’s movement within a rising channel.
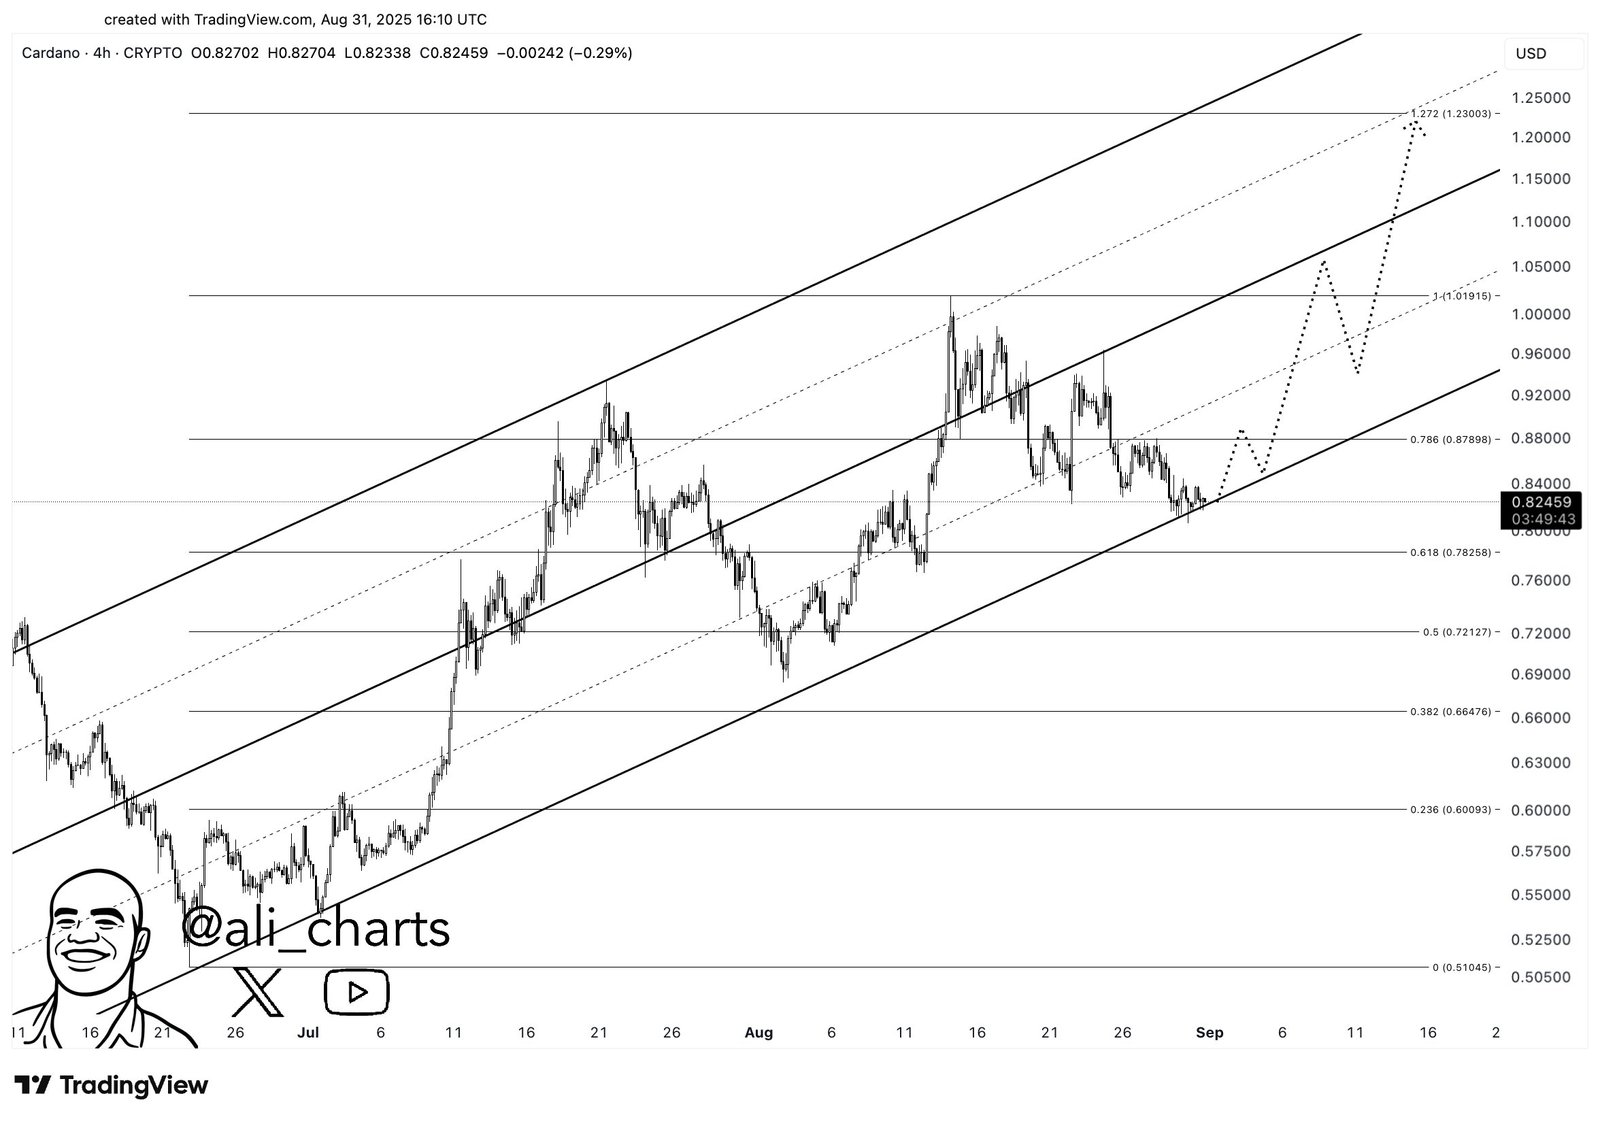
The chart highlights that if ADA closes above $0.88, it could validate a bullish continuation pattern. Martinez indicated that such a breakout would open the way for gains toward $1.05, with a potential extended move targeting $1.20.
At present, ADA trades near $0.82, hovering just below the outlined resistance. The analysis shows that failure to secure the $0.88 breakout could keep the token consolidating in its current range.
Cardano Forms Bullish Flag Pattern Ahead of Possible Breakout
The chart, created on Sept. 1, 2025, shows Cardano ADA/USD trading at around $0.83. The price action has developed a bullish flag pattern, which appears after a strong upward move and usually signals continuation of the trend.
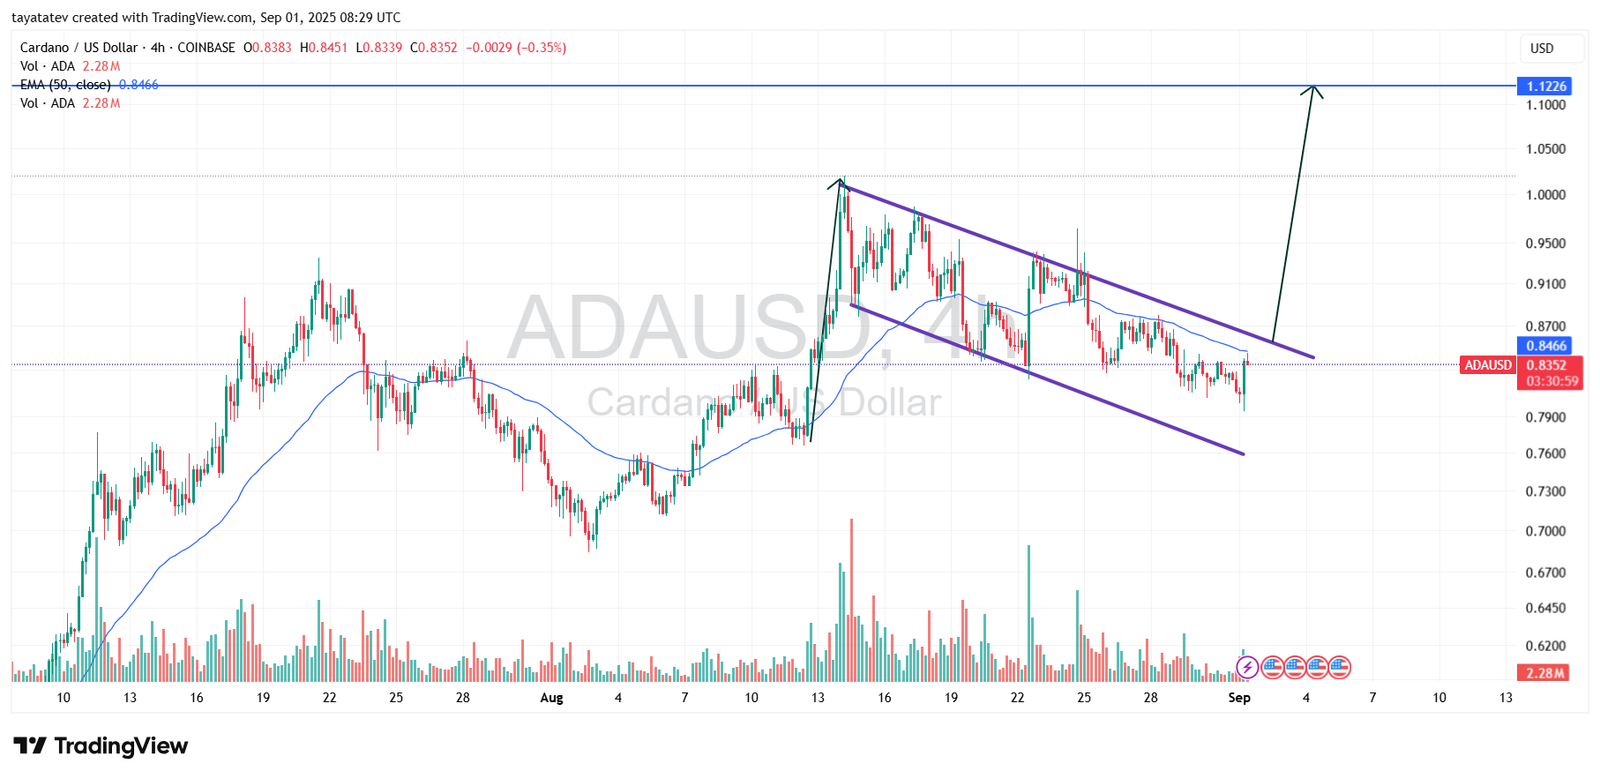
In this setup, ADA rallied sharply in mid-August before entering a downward-sloping consolidation channel. This pullback has taken shape inside parallel trendlines, which define the flag. The blue 50-period exponential moving average currently sits near $0.84, acting as immediate resistance. A confirmed breakout above this zone could validate the bullish structure.
A bullish flag pattern indicates that buyers are pausing before attempting another upward leg. If ADA confirms the breakout, the measured move suggests a 33 percent rally from the current price, which would target approximately $1.12. The chart projection also aligns with this level, marking it as the next significant resistance zone.
Until confirmation occurs, ADA remains within the flag, testing both support and resistance boundaries. However, the presence of strong volume spikes during recent upward moves provides additional evidence that momentum could favor bulls once ADA clears resistance. This analysis points to a decisive test in the days ahead.
Cardano RSI Signals Neutral Momentum
The chart, created on Sep. 1, 2025, tracks Cardano’s relative strength index (RSI) on the 4-hour timeframe. The RSI line currently reads 51.92, while the moving average stands at 42.72. This positioning places ADA in a neutral zone, neither overbought nor oversold.
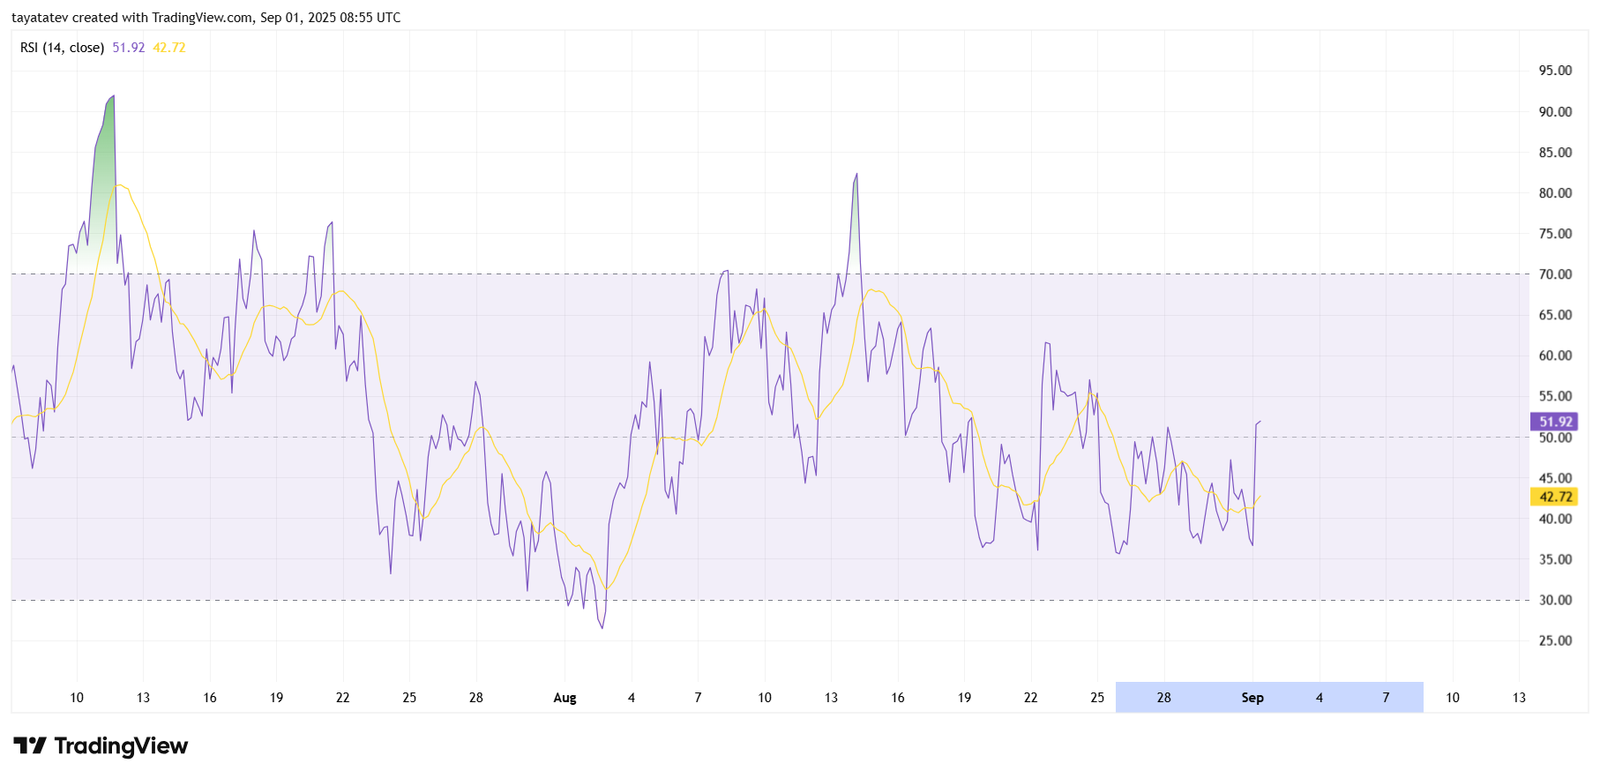
During August, RSI values swung between 30 and 70, reflecting alternating periods of selling and buying pressure without decisive dominance. The latest uptick above the moving average indicates a mild shift toward bullish momentum, but the strength remains moderate.
As long as RSI stays near 50, ADA may continue consolidating without strong trend confirmation. A sustained move above 60 would suggest growing buying pressure, while a drop below 40 would indicate renewed selling. The current levels highlight a market waiting for a clearer breakout signal.
Cardano MACD Shows Early Signs of Recovery
The chart, created on September 1, 2025, presents Cardano’s MACD indicator on the 4-hour timeframe. The blue MACD line currently stands at -0.0066, while the orange signal line sits lower at -0.0093, with a histogram value of 0.0027.

The histogram has turned slightly positive, suggesting momentum is shifting in favor of buyers. This move indicates that bearish pressure is weakening, and the market could be preparing for a bullish crossover if the MACD line continues to climb above the signal line.
Throughout August, the MACD fluctuated with several crossovers, reflecting Cardano’s volatile price swings. The latest upward turn resembles earlier recovery phases, though the strength remains limited at this stage. A sustained positive histogram combined with a confirmed crossover would support a stronger upward trend.
Overall, the MACD analysis signals that Cardano is showing early recovery momentum, but confirmation of a bullish reversal requires further continuation of this crossover pattern.
Cardano Balance of Power Points to Buyer Advantage
The chart, created on Sept. 1, 2025, displays Cardano’s Balance of Power (BoP) indicator on the 4-hour timeframe. The current BoP reading sits at 0.29, which suggests that buyers are holding more influence than sellers.

Throughout July and August, the BoP fluctuated sharply between positive and negative values, reflecting ongoing battles between bulls and bears. Periods of strong upward spikes corresponded with short-term rallies, while deep drops aligned with price corrections.
The latest move into positive territory shows that buyers are regaining control after a period of uncertainty. As long as BoP stays above zero, market momentum favors accumulation, which could support a push higher if accompanied by stronger volume. A drop back below zero would indicate renewed selling pressure.
