
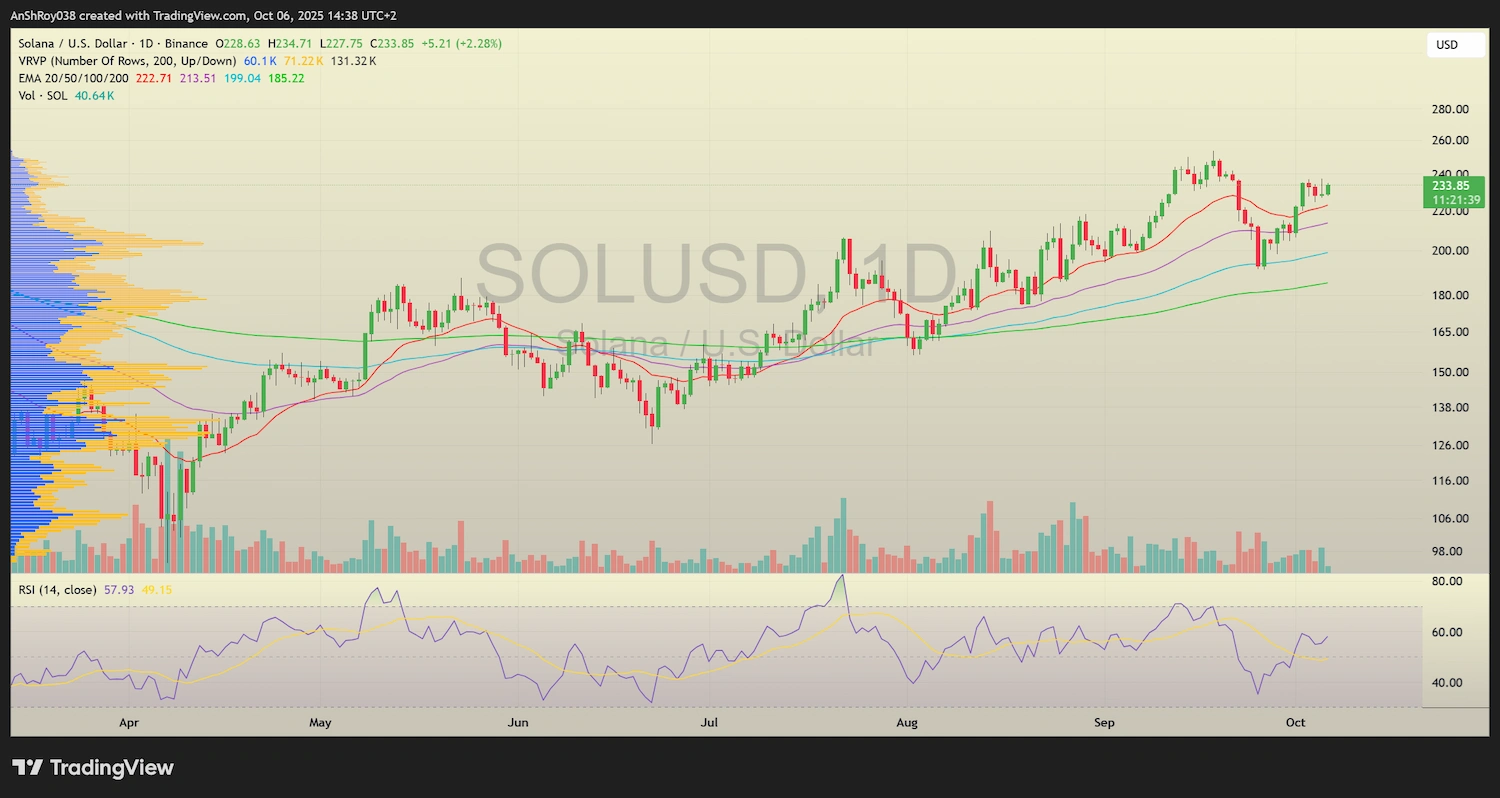
Solana (SOL) price climbed nearly 12% since the start of Oct. 2025, though the rally cooled in recent sessions. However, the token remained green, with a spike of over 2% on Oct. 6. SOL price pulled back near $232 after briefly touching $234, signaling renewed buyer strength near short-term moving averages.
Market momentum built steadily as traders positioned for a breakout above the $250–$253 zone, which analysts, including CW and Laxman, identified as the critical resistance area. Meanwhile, institutional holdings in Solana’s treasury-linked assets continued to fluctuate.
Analysts See $250 as Solana’s Make-or-Break Level
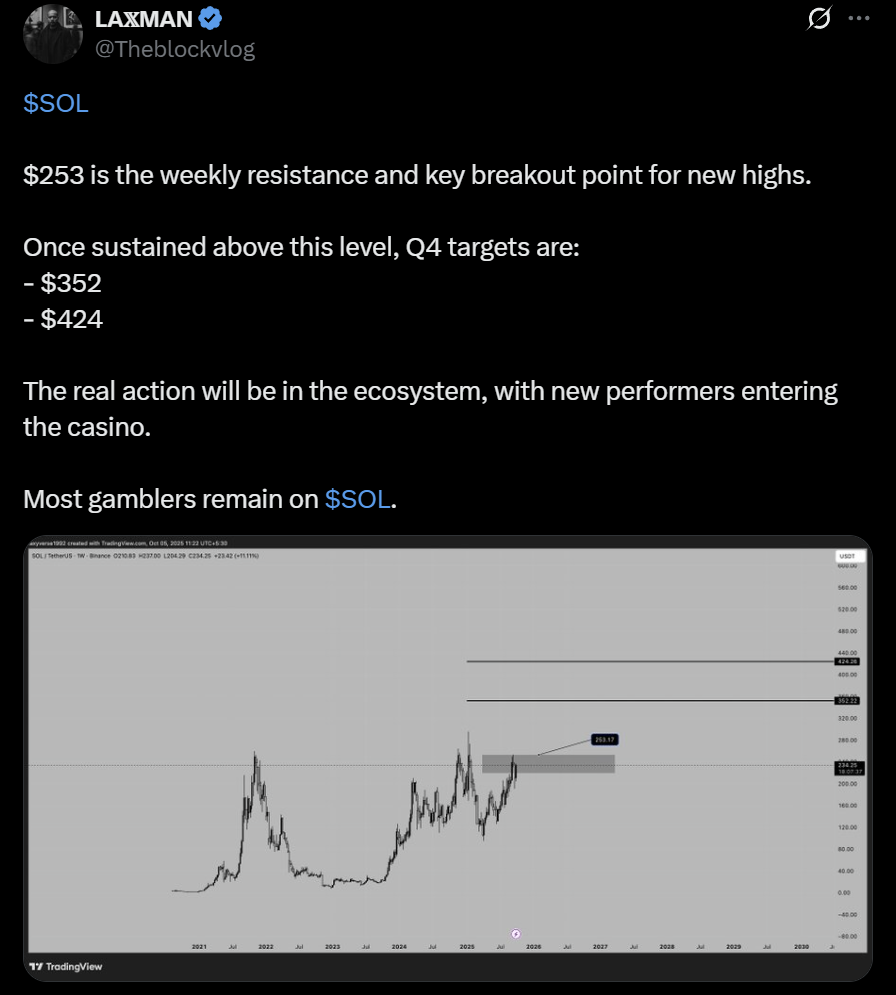
Analysts’ projections reinforced the bullish momentum that followed Solana’s early October rebound. Market analyst Laxman identified $253 as the weekly resistance and key breakout level for new highs, placing potential Q4 SOL price targets at $352 and $424.
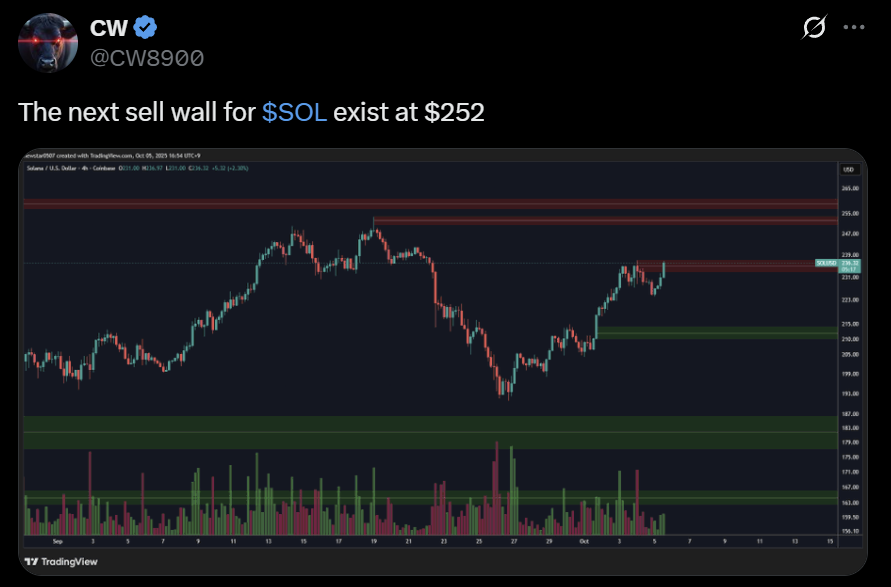
The analyst’s view aligned with recent price behavior, where each recovery attempt stalled just below this zone. CW, another market analyst, pointed to a heavy sell wall near $252, calling it the next major barrier for bulls.
The overlap of both readings established the $250 range as Solana’s decisive technical hurdle. Adding context, analyst Zyn highlighted a recurring pattern in Solana’s market rhythm. The analyst noted that since Q2, every 25% correction in the token’s price action had led to a 50% to 60% rebound, forming a repeatable cycle of rallies and pullbacks.
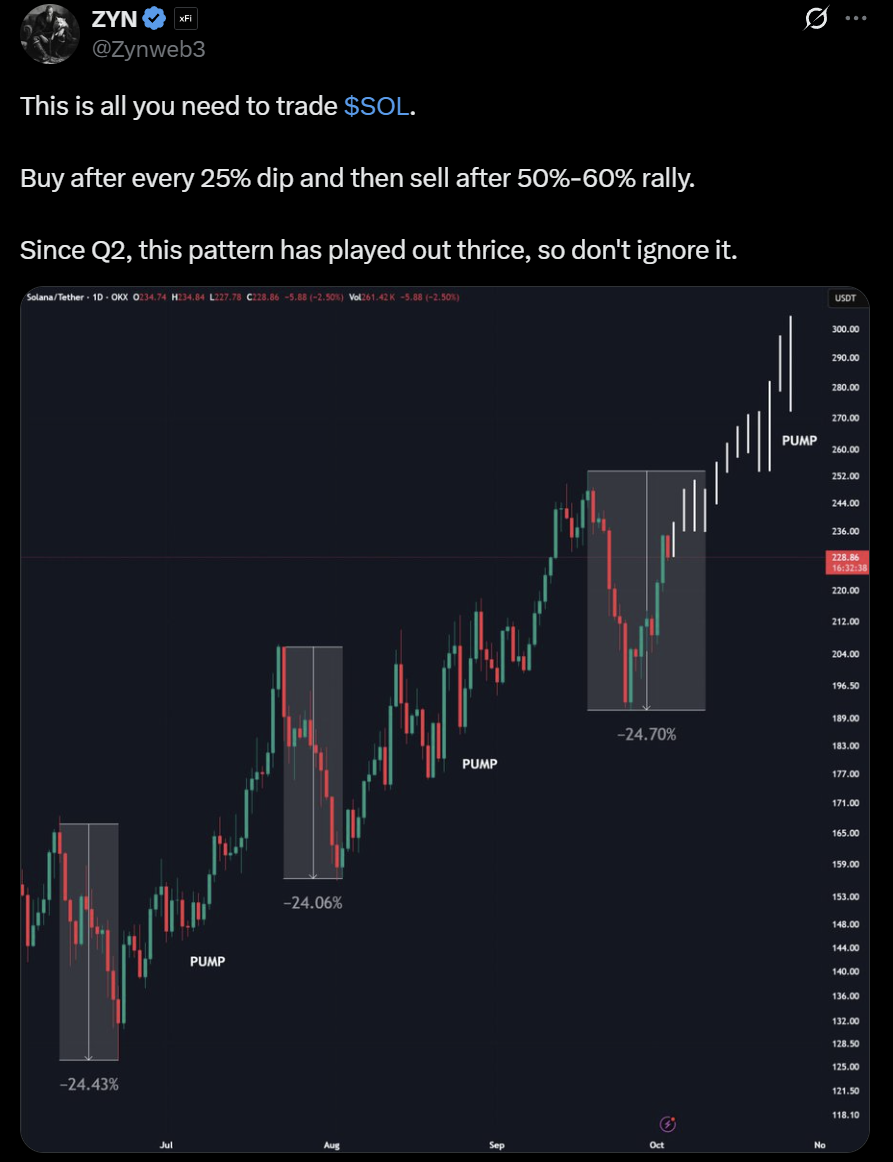
The latest recovery fit the same structure, reinforcing the argument that Solana’s uptrend could resume if the resistance broke cleanly. Meanwhile, Fractlab’s long-term projection added a broader layer to these short-term targets.
Using its proprietary Fractal Wave Marker 10.2, a model that organizes historic price “progressions” to forecast cyclical movements, the analysis placed Solana in the early-to-mid phase of a multi-year expansion structure.
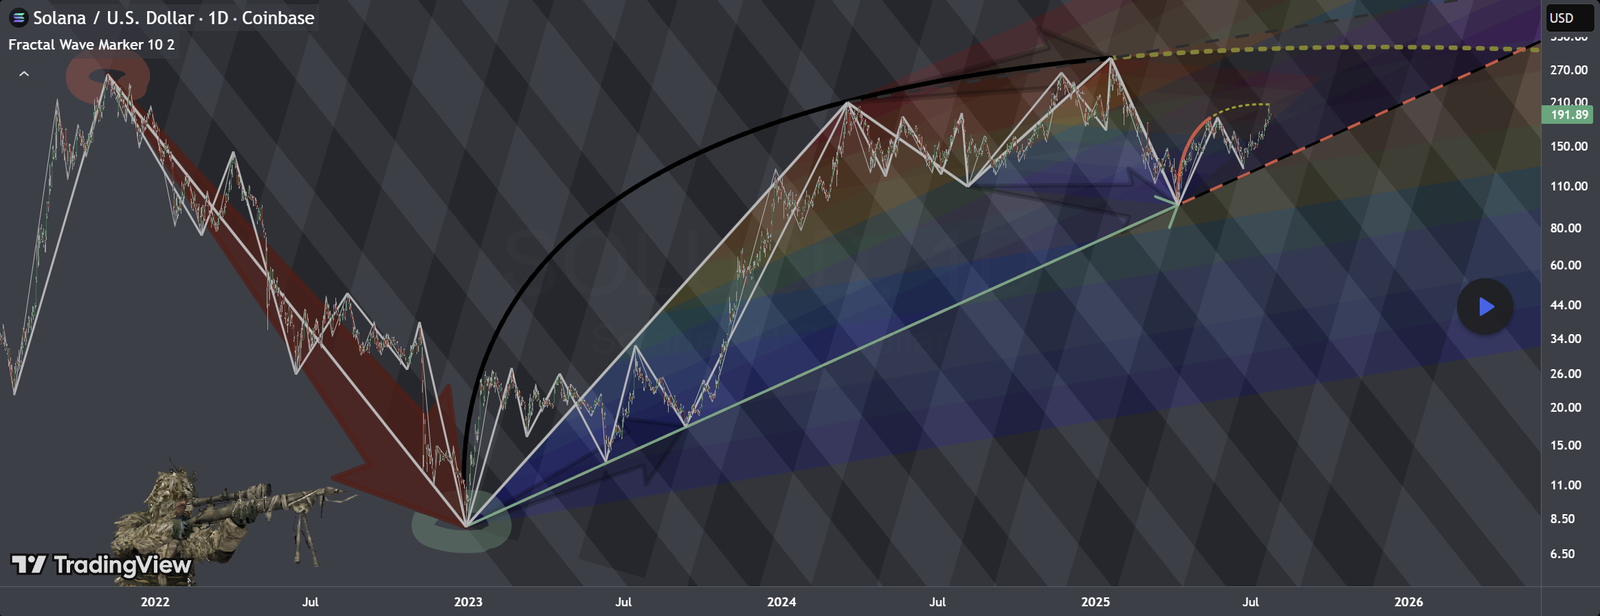
Fractlab’s model projected a confluence of resistance for the SOL USD pair around the $250–$270 region, followed by a potential climb toward the next fractal arc if sustained buying pressure emerged. Analysts viewed Solana’s near-term direction as dependent on how it interacted with the $250 threshold.
A confirmed breakout above that line could mark the transition from consolidation to expansion, while failure would likely extend the familiar rhythm of dips before the next leg higher.
Institutional Activity Contrasts with Treasury Weakness
While analysts tracked price action, Solana’s treasury-linked activity revealed a mixed picture. Data from Crypto Patel showed the Strategic Solana Reserve had expanded to 17.8 million SOL, valued at about $4.13 billion.
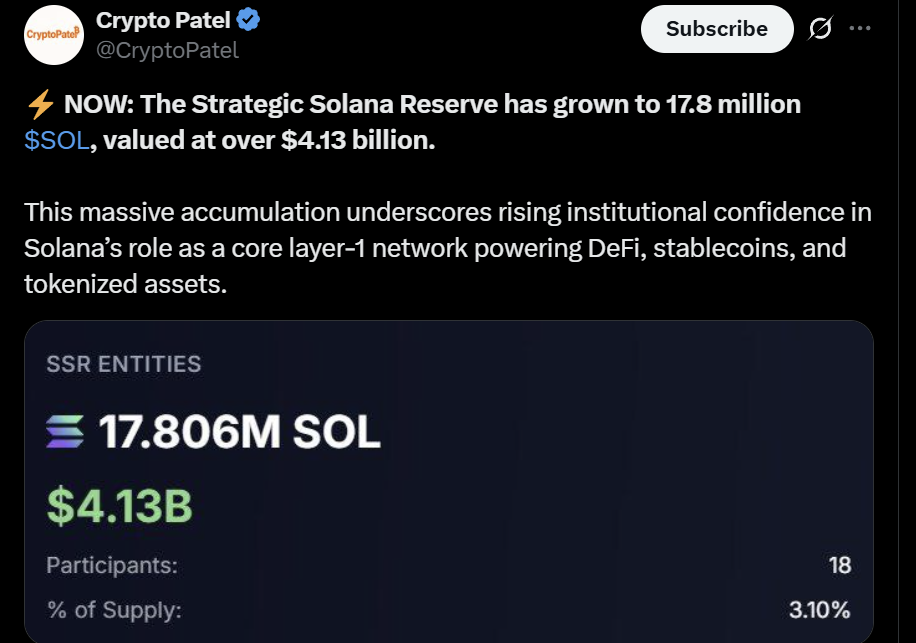
The buildup suggested institutional entities continued adding exposure, treating Solana as a primary Layer-1 bet. Yet this accumulation contrasted sharply with the decline in companies holding SOL on their balance sheets.
Independent analyst Ted noted that listed firms with major Solana allocations — including Sol Strategies, Forward Industries, and Sharps Technology — had seen their share prices slump. Ted pointed out that one entity with $1.5 billion in SOL had already offloaded roughly half within weeks, signaling pressure across treasury portfolios.
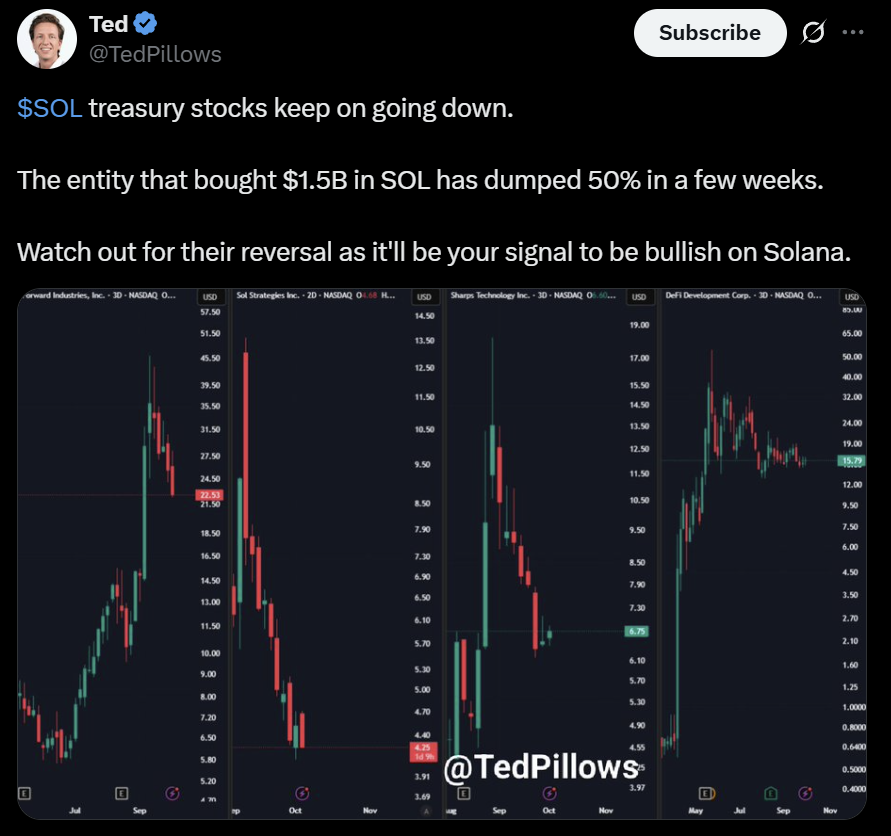
The sell-off coincided with broader weakness in speculative tech equities, underscoring the fragility of sentiment among corporate holders.
Despite the heavy trimming, on-chain reserves remained stable, suggesting that the selling came from balance-sheet investors rather than ecosystem participants. The divergence reinforced the idea that market conviction was concentrated among long-term holders rather than financial entities seeking short-term exposure.
Solana’s next move could redefine its rally — check back soon for fresh updates as it tests the $250 breakout zone.
