
XDC’s daily chart shows a clear falling wedge from late July into early October, with price compressing between descending trend lines and now pressing the upper boundary near the 50 day EMA around 0.0773. A decisive daily close above this downtrend line would confirm a breakout and shift momentum to the upside. This setup points to a recovery toward the 0.12 to 0.13 zone rather than a move to 1.
A falling wedge forms when price makes lower highs and lower lows inside converging lines while downside energy fades. Traders watch for a break through the upper line on expanding volume, then look for follow through above a nearby moving average or prior swing level. On this chart, the wedge top sits just above today’s price, and the first confirmation threshold aligns with the 50 day EMA. A close and hold above both would validate the pattern.
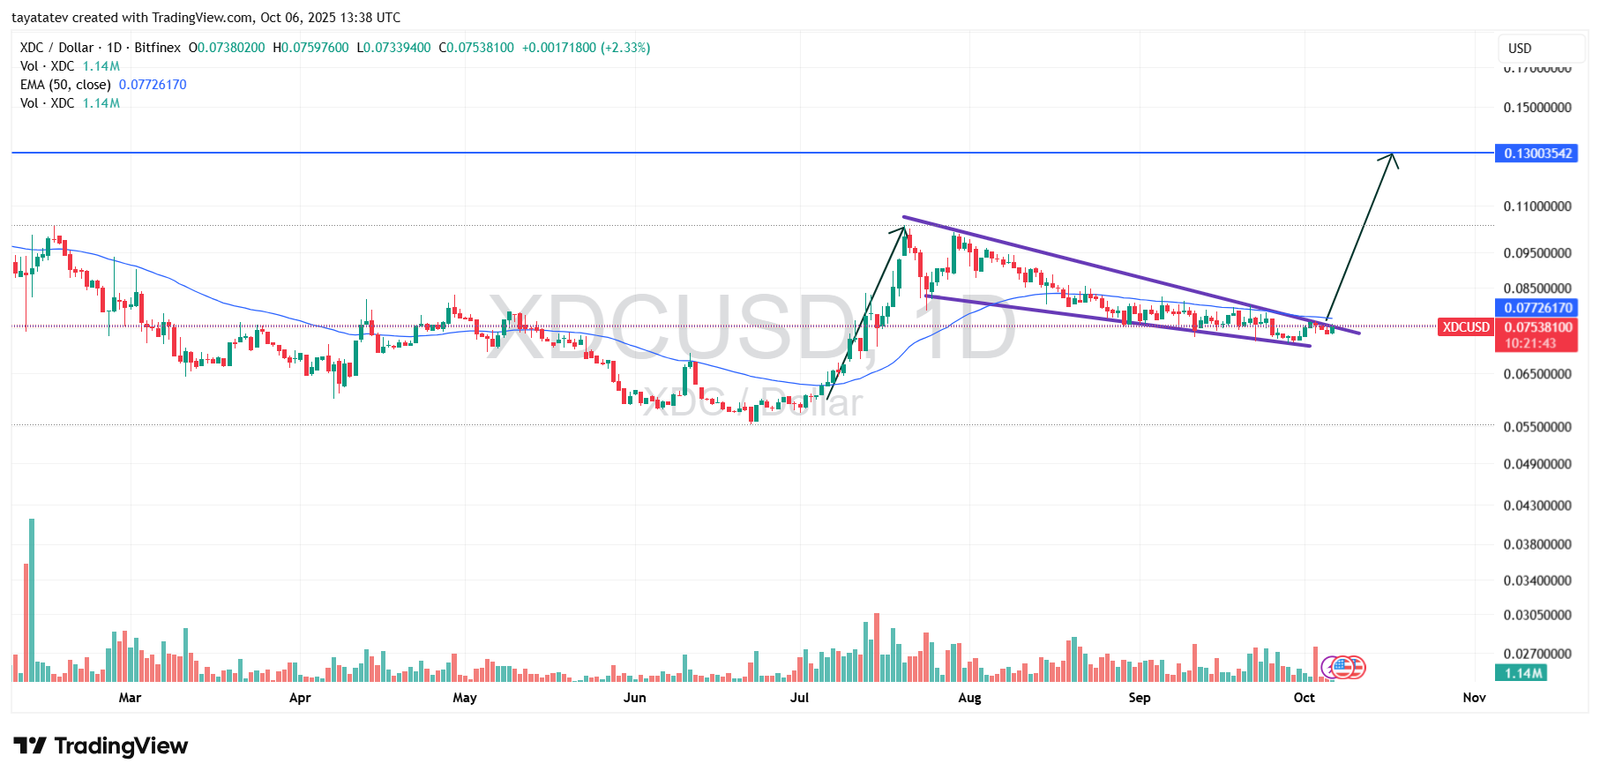
From today’s spot near 0.075, a 68 percent advance calculates to roughly 0.1266. That figure closely matches the chart’s drawn objective around 0.13, which also marks a visible horizontal supply zone. Therefore, if the breakout confirms, the measured path favors a run into 0.12 to 0.13, with interim reactions likely at prior swing highs. The height of the wedge added to the breakout area supports the same band, which keeps the projection consistent.
However, the chart does not argue for 1 at this stage. Moving from 0.075 to 1 requires about a thirteen times increase, far beyond the present wedge implication. To reach that debate, price would first need to reclaim the summer highs, convert the 0.13 area into support, and establish a higher time frame uptrend. None of those conditions appear on this single pattern alone.
Risk remains straightforward. If price fails to break and instead loses the lower wedge line, the pattern invalidates and the bullish read weakens. A daily close back below the recent base around the low 0.07s would signal that sellers still control the range.
In sum, the chart prints a textbook falling wedge and sits at the breakout trigger. If confirmed, the structure supports an advance of about 68 percent from the current level to roughly 0.1266, with 0.13 as the next strong ceiling. That target aligns with the drawing on the chart, while the 1 question stays outside the scope of this pattern.
RSI momentum: neutral structure shifting upward
The Relative Strength Index (RSI) on the daily chart stands at 50.25, moving above its signal line, which is currently at 43.72. The RSI measures the speed and magnitude of price movements over a set period—in this case, 14 days. Readings near 50 reflect balanced momentum, while readings above 70 indicate overbought conditions and below 30 suggest oversold levels. The signal line smooths out the RSI’s fluctuations to show trend direction more clearly.
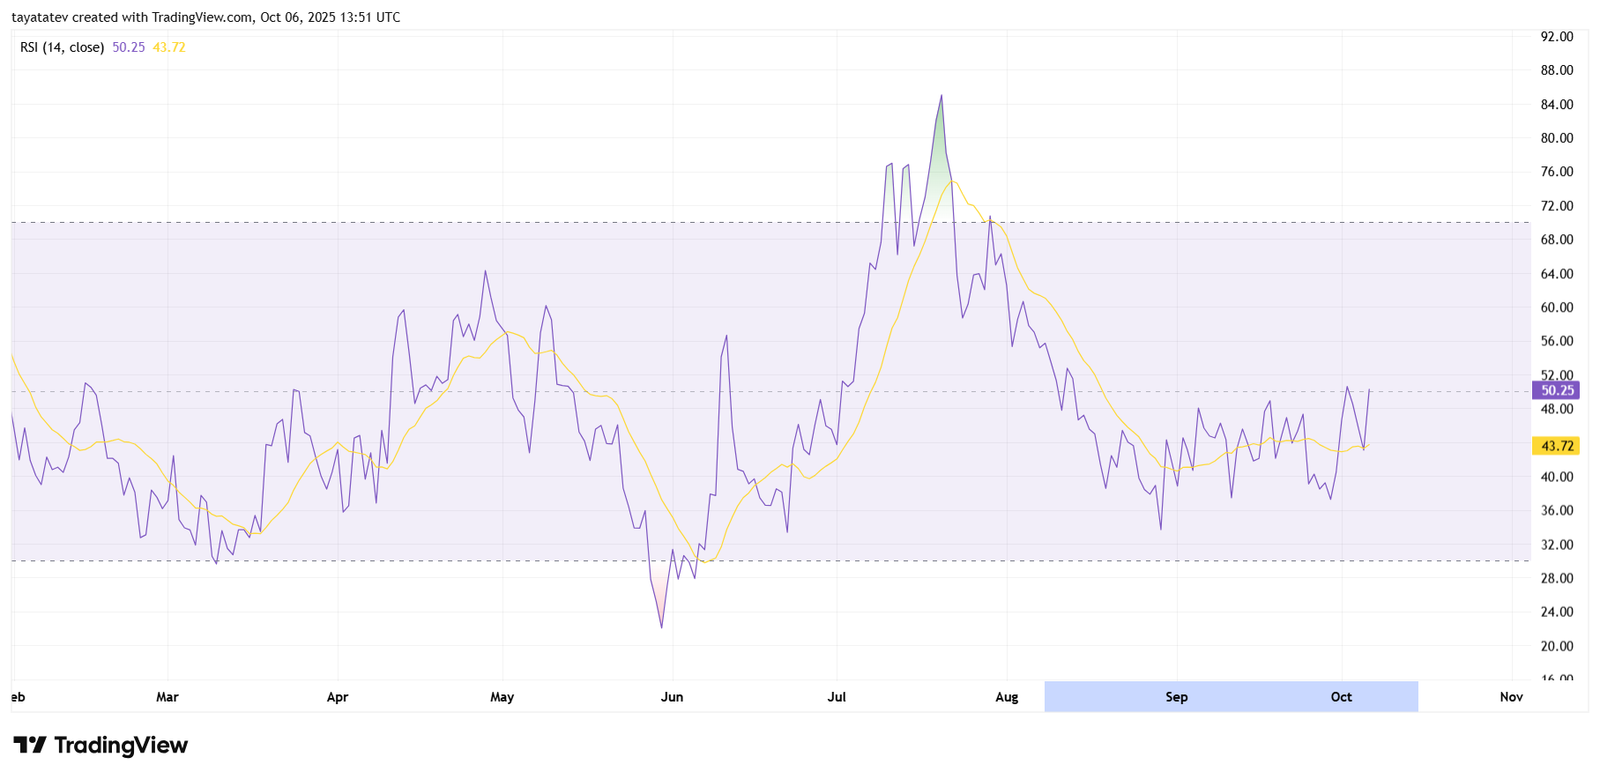
Over the past three months, the RSI has followed the broader price action. It peaked above 80 in early August during the sharp rally, then dropped steadily as price entered the falling wedge formation. By mid-September, the RSI stabilized in the low 40s even as price made marginally lower lows. That created a mild bullish divergence, where momentum stopped weakening even though the chart continued to compress. Such divergences often appear near the end of corrective patterns.
Now, RSI has turned upward and crossed above its signal line for the first time since early August. This crossover signals that downward momentum is fading and buyers are beginning to regain control. With the indicator just above the neutral 50 level, there is significant room before typical overbought thresholds near 70. This gives any confirmed breakout from the falling wedge a supportive momentum backdrop. If the RSI climbs steadily into the 60–65 range, it would align with a bullish continuation toward the 0.12–0.13 price target highlighted on the price chart.
However, this early shift in momentum still requires confirmation. If the RSI rolls back below 45 and the signal line flattens or turns down, the market would lose its developing bullish momentum. That would weaken the breakout scenario and imply that the wedge structure is not yet resolved. For now, the RSI shows a neutral structure tilting upward, providing the first signs of positive momentum after months of decline.
MACD momentum: bear phase ending, early bullish turn
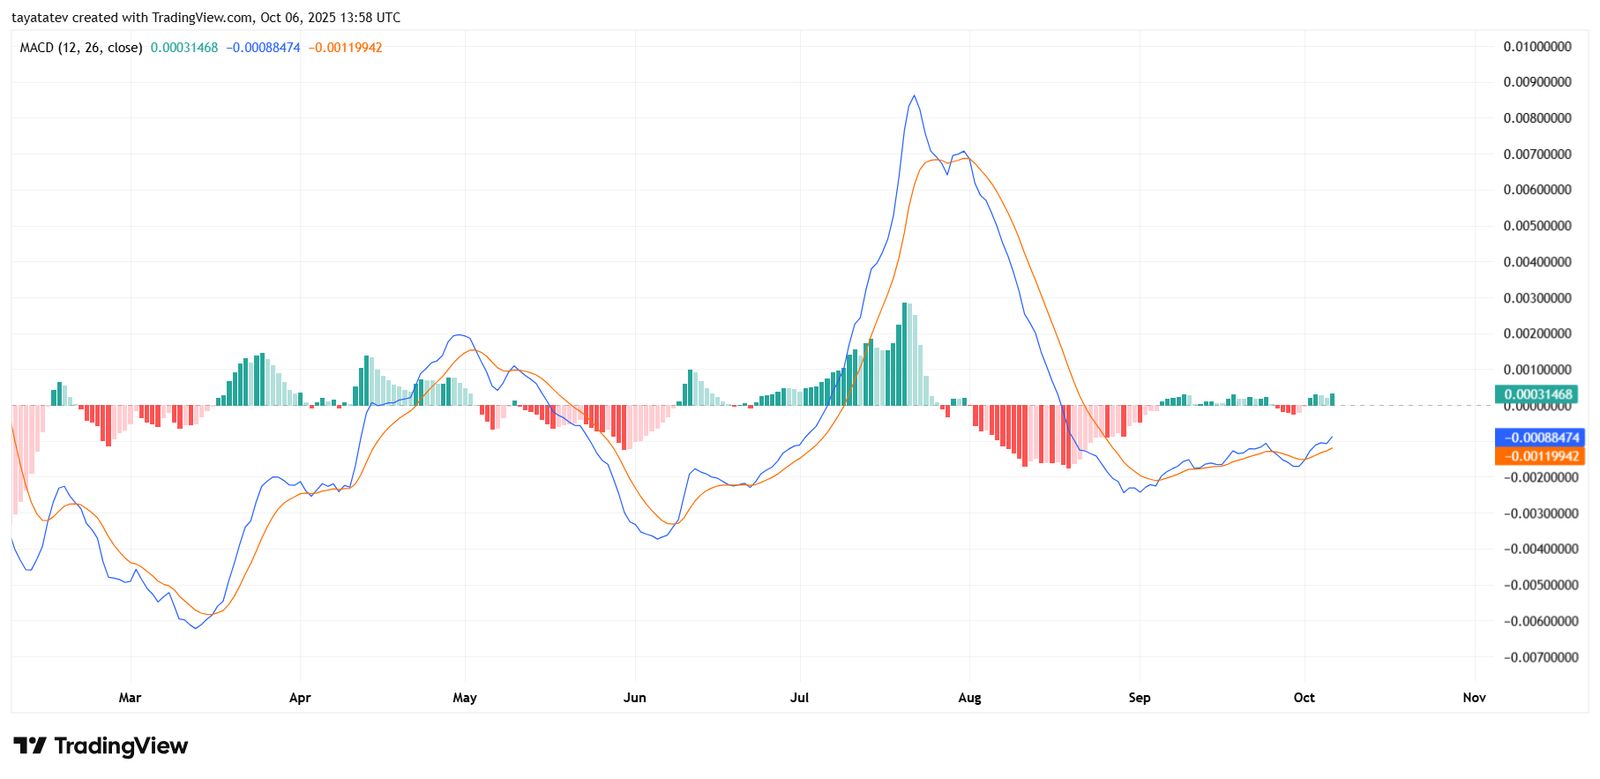
This crossover supports the bullish read from the wedge. When MACD lifts through its signal and the histogram stabilizes above zero, rallies often extend as moving averages catch up to price. Here, the lines are still close to the zero line, so momentum is early rather than stretched. Therefore, the indicator leaves room for follow-through if price breaks the wedge top and holds above the 50 day exponential moving average.
However, the signal needs confirmation. If the blue MACD flattens and slips back under the orange line while the histogram turns red below zero, the market would reassert a neutral-to-bearish stance and undercut the breakout case. For now, MACD shows a completed bull cross near the zero line, aligning with a developing shift from contraction to expansion and backing a move toward the 0.12–0.13 objective if price confirms.
