
Hedera Hashgraph’s token, HBAR, saw its price surge over 22% on Oct. 28 to reach a daily high near $0.22. The token’s price action reacted to Nasdaq’s Canary HBAR Spot ETF listing confirmation.
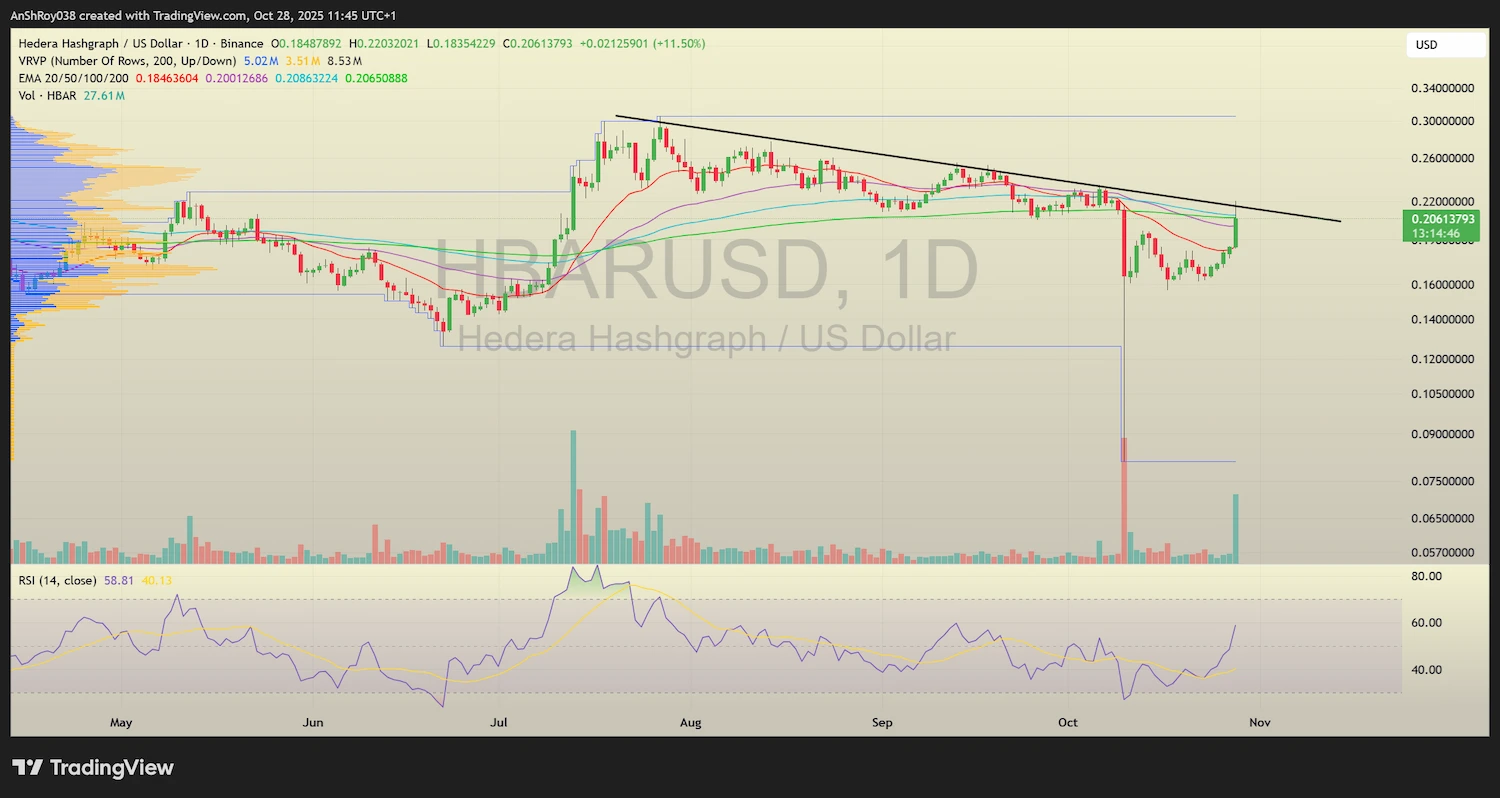
The token reclaimed short-term momentum, breaking above key moving averages, but failed to conquer a multi-month descending trendline that had capped rallies since July. Rising volume supported the breakout, while RSI crossed 60, signaling renewed bullish pressure. Market sentiment improved after the ETF approval, which marked the first direct HBAR exposure vehicle in the U.S.
HBAR Spot ETF Launch Ignites Institutional Optimism
The rally followed Nasdaq’s confirmation that Canary’s HBAR Spot ETF would begin trading on Oct. 28. The approval marked a milestone for Hedera, positioning it among the few altcoins with a regulated U.S. exchange-traded product. The ETF offered direct spot exposure to HBAR, with assets held in custody by Coinbase and BitGo.
Excitement swept across the HBAR community soon after the filing appeared on the SEC’s database.
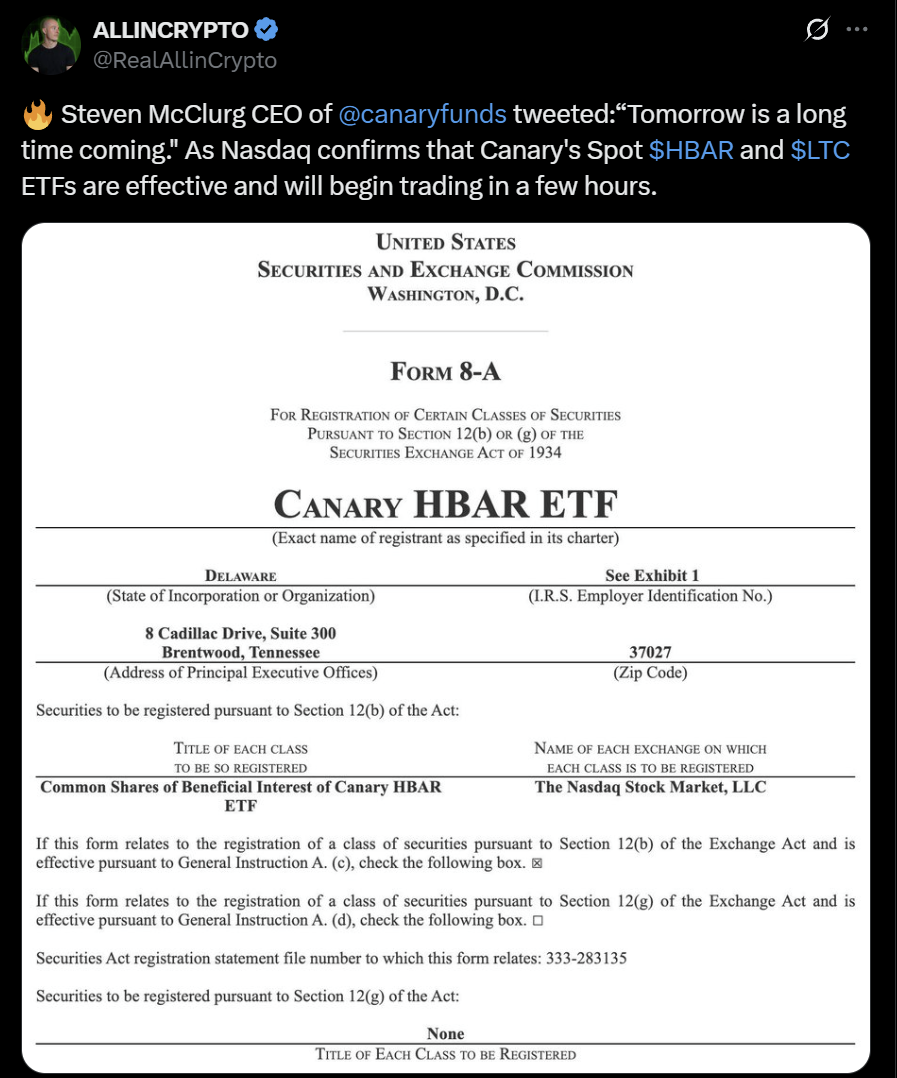
Investors interpreted the move as long-awaited recognition of Hedera’s growing institutional relevance. Steven McClurg, CEO of Canary Funds, described the launch as “a long time coming,” reflecting the months of anticipation since the firm’s earlier submissions.
Market analysts framed the ETF as more than a short-term trading catalyst.
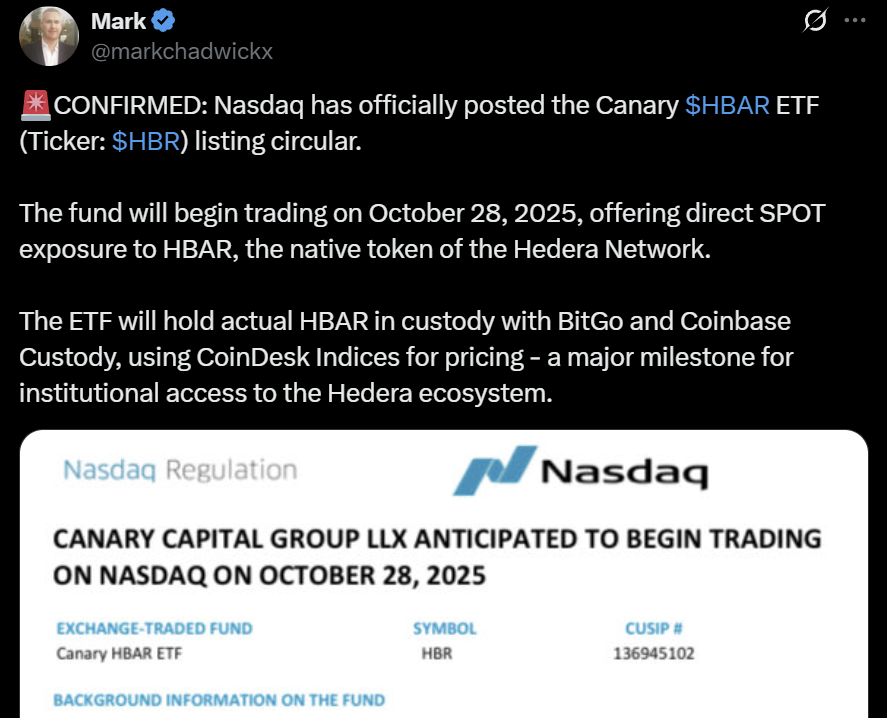
The listing could allow asset managers, family offices, and retirement funds to gain direct access to HBAR without custody risk. The development also strengthened Hedera’s narrative as an enterprise-grade blockchain attracting mainstream finance.
Social media sentiment turned overwhelmingly positive as trading hours approached. Traders shared price targets, citing that regulated exposure often boosts liquidity and visibility for the underlying token. The ETF announcement provided fresh momentum, with bulls framing the listing as Hedera’s entry into the institutional spotlight.
Analysts See Technical Breakout as ETF Momentum Builds
The ETF listing coincided with strong technical signals that reinforced bullish sentiment across trading circles. Analyst Trading Nomadic identified a third rising valley on the HBAR chart, pointing to a potential 100% measured move into the 1.618–2.0 Fibonacci extension range.
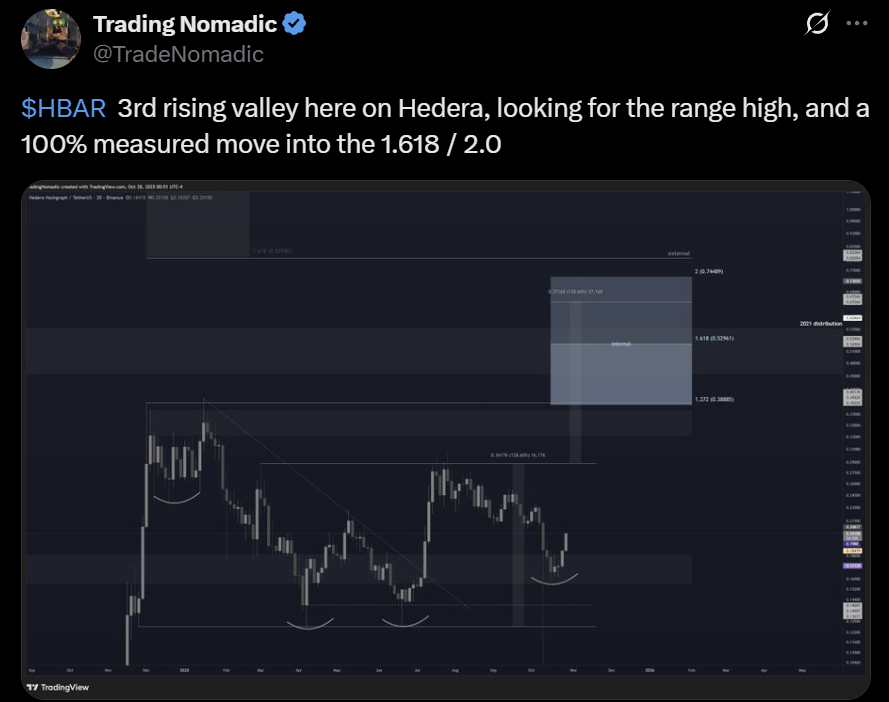
His setup implied an extended breakout if volume sustained above the current range, echoing bullish continuations in previous cycles.
Another X-based analyst, ZAYK Charts, projected a 50–60% upside move, highlighting a clean breakout from a descending channel that had contained price action since August 2025.
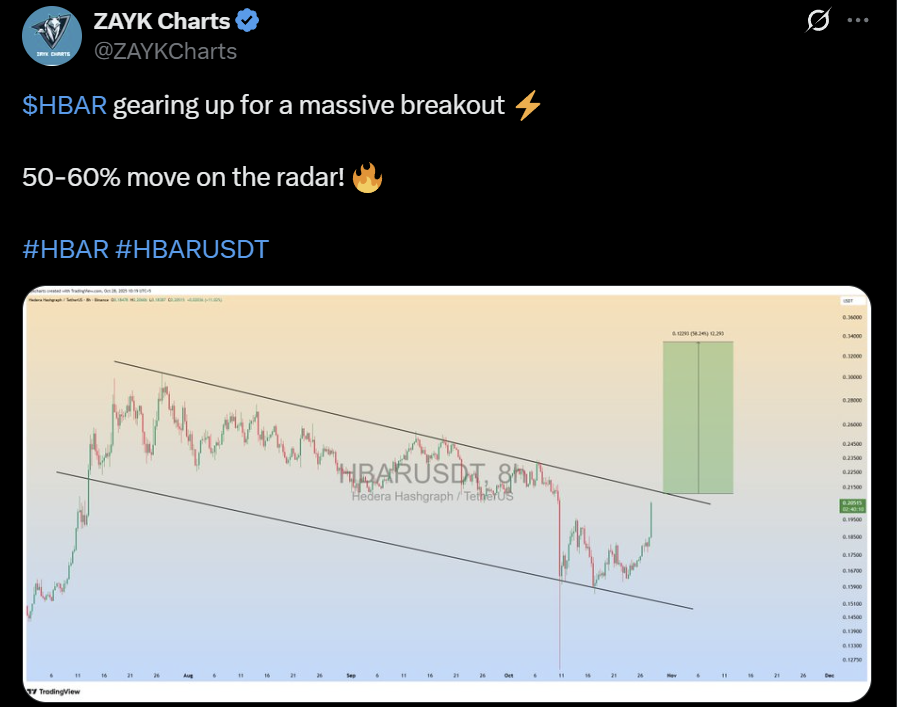
Zayk’s analysis noted a breakout confirmation with strong follow-through, suggesting momentum traders could push the HBAR USD pair toward the upper boundary near historical resistance zones.
Meanwhile, Bitbull Trading emphasized short-term momentum after HBAR gained more than 13% in 24 hours.
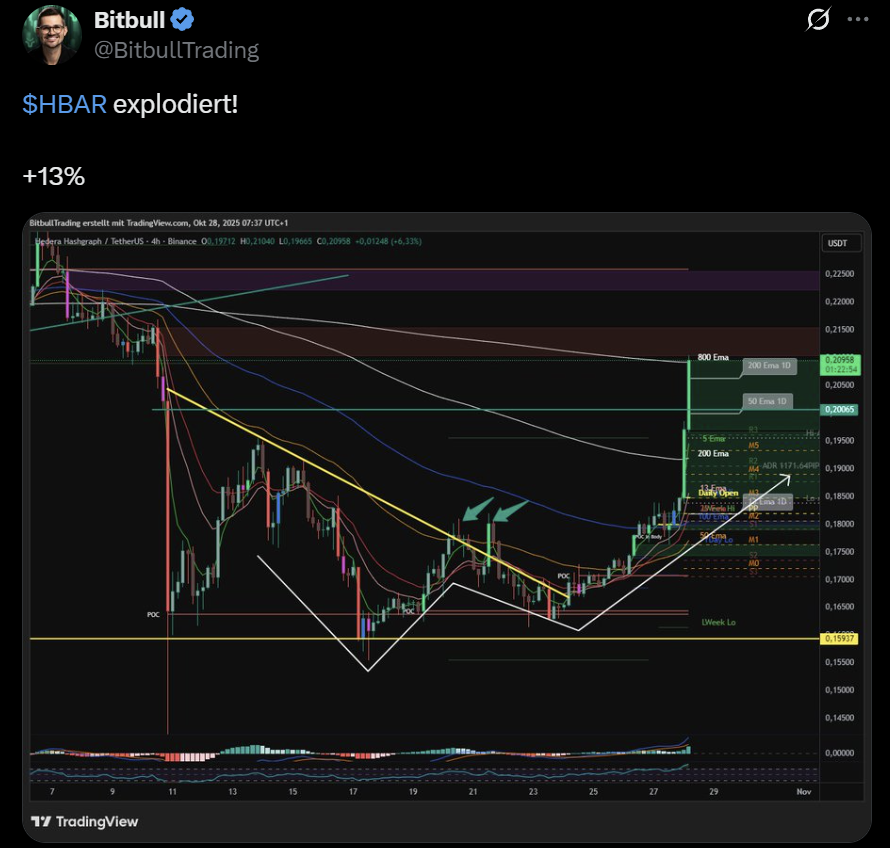
The analyst’s chart showed the token reclaiming its 50-day and 200-day EMAs, supported by strong volume expansion and MACD alignment. The crossover reinforced bullish control, which could continue if the price held above $0.20.
The projections reflected growing conviction that HBAR’s structure had shifted from accumulation to expansion. The technical alignment with the ETF announcement bolstered the view that HBAR could attract sustained institutional and retail participation in the sessions ahead.
