
Bitcoin fell sharply on Oct. 30, slipping from around $116,000 toward the $108,000–$110,000 range as traders reacted to fresh global developments. However, buyers moved in a day later, propping BTC price back above $109,000, with bulls now targeting the $110,000. The drop followed the announcement of a new U.S.–China trade agreement that eased tariffs and hinted at a thaw in relations between the two largest economies.
While the deal reduced geopolitical tension, it also prompted a flight from risk assets as investors rotated back into equities and commodities. Meanwhile, cautious signals from the Federal Reserve added to the pressure. Officials indicated that the pace of future rate cuts might slow, dampening hopes for extended liquidity support that had fueled Bitcoin’s earlier rally.
Still, the current decline fits a familiar pattern seen around previous FOMC (Federal Open Market Committee) periods. Bitcoin has often dipped after major policy events only to rebound sharply once leveraged positions reset. If the historical rhythm holds, buyers could wait for the next recovery cue — a bullish fractal repeated multiple times this year.
Recurring FOMC Pattern Aligns With Current Liquidity Setup
The market’s latest move appeared to extend a familiar structure that several analysts had tracked throughout this year’s Federal Open Market Committee cycles. Each policy update from the Fed triggered a short-lived correction in Bitcoin. These were followed by a sharp rebound once leverage reset. Analysts such as Alex Wacy and Ted Pillows highlighted that the same rhythm seemed to be repeating after the Oct. 29 policy decision. Bitcoin’s recent decline was nearly identical in scale to those seen in June, July, and September.
Alex Wacy noted that Bitcoin had dropped between five and seven percent after each FOMC event before reclaiming new highs in the following weeks.
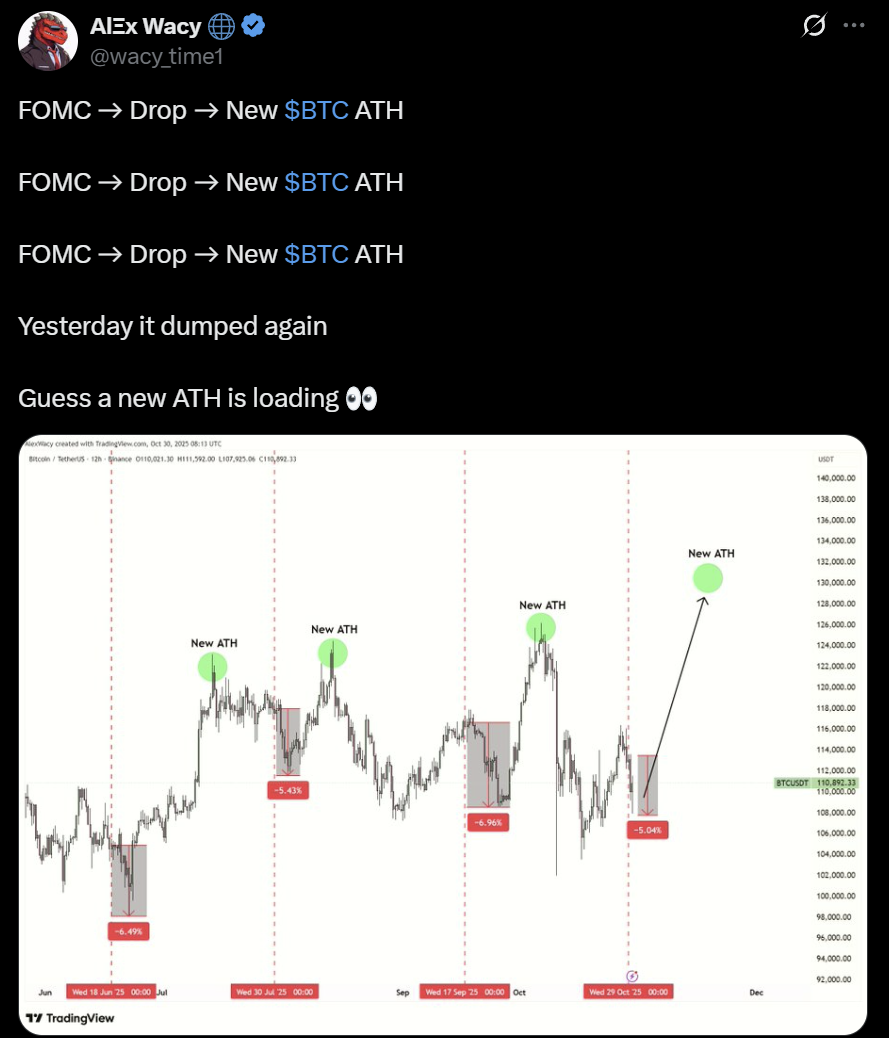
Wacy’s chart suggested that traders typically reduced risk into policy uncertainty and re-entered once clarity returned. This turned post-FOMC volatility into an accumulation opportunity. The analyst viewed the current dip as part of that recurring fractal — a controlled correction that historically preceded breakouts to new all-time highs.
Ted Pillows supported the timing pattern with structural evidence.

Ted’s analysis showed that Bitcoin again retraced sharply after the latest meeting, mirroring the same corrective symmetry. He pointed out that each drop had been followed by a recovery that exceeded the prior high, signaling that institutional flows often resumed once macro dust settled.
Kamran Asghar added a liquidity-based layer to this setup.
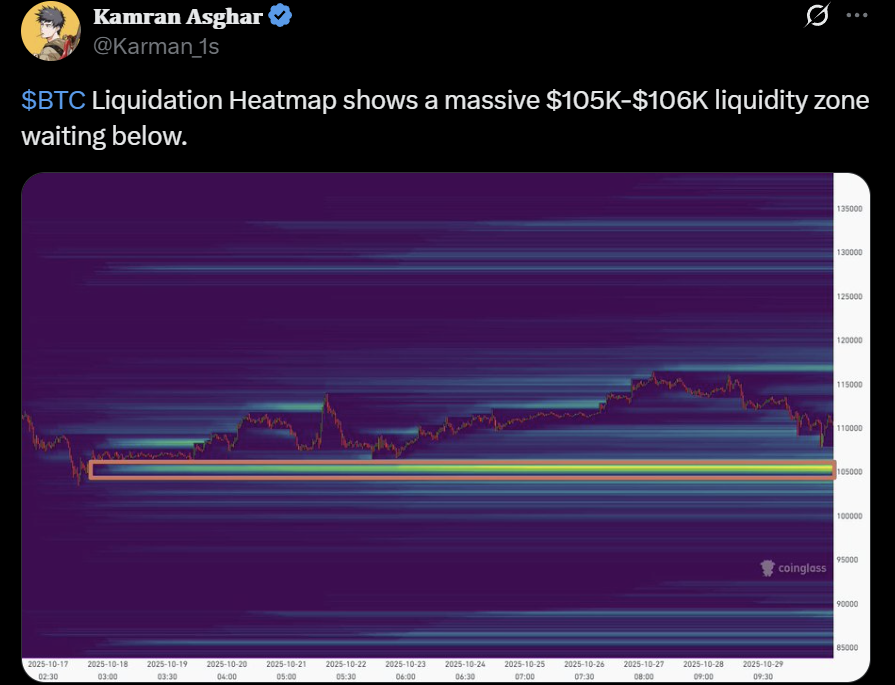
The analyst’s liquidation heatmap revealed a dense cluster between $105,000 and $106,000. The area was acting as a price magnet where long liquidations tend to concentrate. Asghar viewed this as the final stage of leverage cleansing before reaccumulation.
Complementing that, Wimar X observed large outflows from Binance wallets during the slide. This implied mechanical sell pressure as exchanges cleared leveraged positions.
Analysts Highlight Conflicting Structures But Agree on Key BTC Turning Zones
Bitcoin’s current setup divided analysts between structural caution and optimism for a sharp rebound. The divergence reflected how the market balanced short-term weakness against the possibility of a renewed bullish phase once liquidity pressures eased.
Crypto Patel noted that Bitcoin had completed a bearish retest at the $116,000–$117,000 zone, turning it into a major resistance area. The analyst maintained a bearish bias below this level. He described the market as vulnerable to deeper retracement targets near $105,000, $93,000, and $76,000.
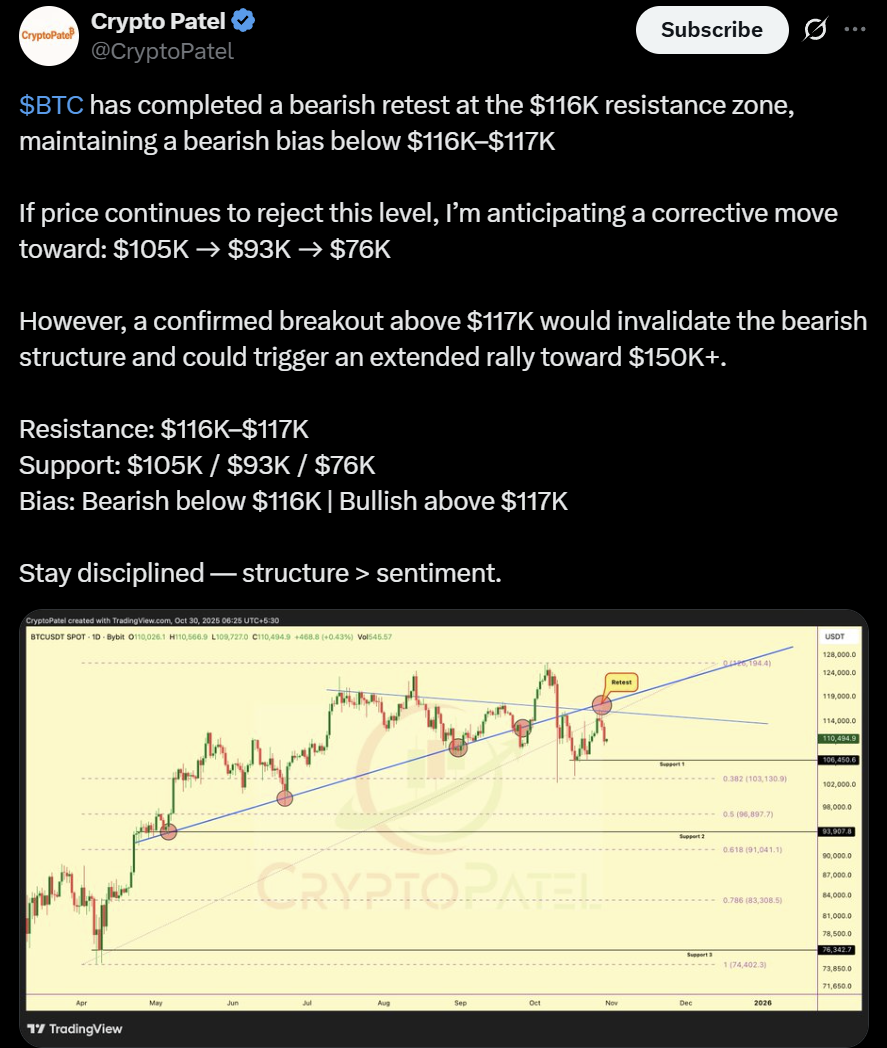
Patel’s chart framed the structure as a clean rejection of the prior ascending trendline, a typical setup before a mid-cycle reset. However, he emphasized that a confirmed daily close above $117,000 could invalidate the bearish formation and reignite the uptrend toward $150,000.
Is a Bitcoin Reversal Ahead?
NekoZ, in contrast, identified Bitcoin’s movement within a broad parallel channel stretching from August. The analyst pointed out that the BTC USD pair had recently bounced from the lower boundary near $108,000, a level that repeatedly triggered reversals in previous months.

NekoZ’s chart suggested that the market could pivot higher, with $132,000 as the first major resistance if momentum expanded. The structure implied an accumulation phase at the lower band of the range. This was supported by higher lows forming on intraday timeframes.
Ted Pillows added a liquidity-based view, observing that Bitcoin price reclaimed the $107,000 support after a brief breakdown.

Additionally, Pillows marked $112,000 as the critical short-term reclaim that could confirm a broader reversal structure. If that level failed, he warned, Bitcoin risked another sweep below $105,000 before stabilizing.
Above all, the overlapping analyses reinforced a simple message: the correction phase was technical, not emotional, and the next breakout direction would depend on how Bitcoin behaved around its immediate liquidity pivots.
