

Jaipur (CoinChapter.com) — Litecoin (LTC) buyers looking to capitalize on the cryptocurrency’s recent uptrend might be in for some trouble. Technical charts show that after a two-day-long rally, a dip and is inevitable.
LTC/USD supported but…
…bears have taken over Litecoin’s relief rally. It seems as if the upsurge was nothing more than an exercise in booking quick profits. On the 4-hour chart, Bitcoin’s “light” counterpart remains supported above the 20-day exponential moving average (EMA). But sustained bearish pressure might not help much and erase most of the recent gains.
Read More: Litecoin Hits All-Time High Amid Crypto Market Boom — Crash Ahead?
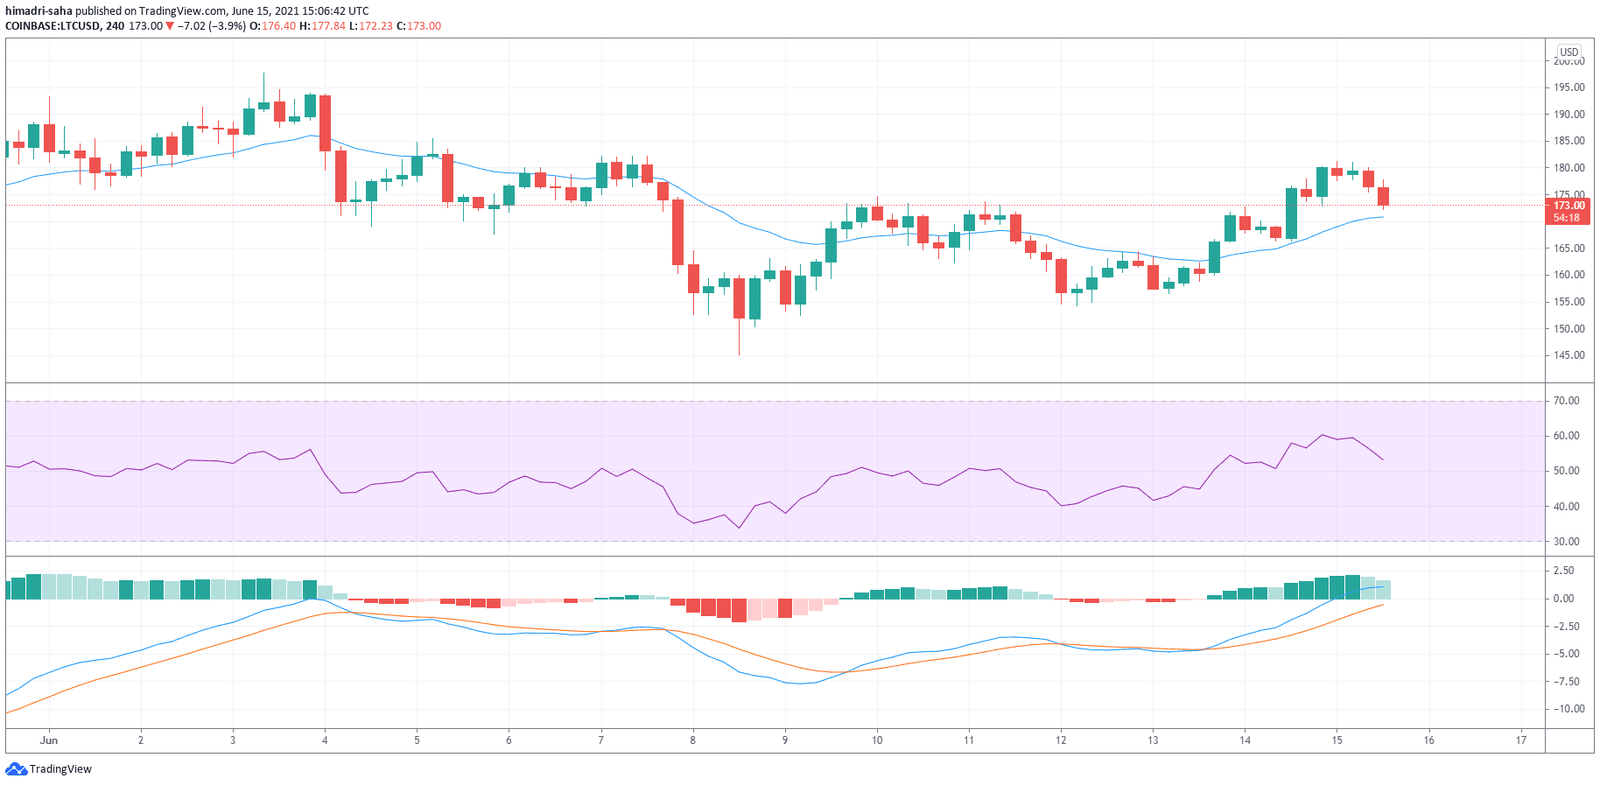
A break below the 20-day MA (moving average) will confirm the bearish trend reversal. Further movement down to the 50-day MA will confirm a “lights out” situation.
Gameplan
Until critical supports like the ones mentioned above are broken, this is nothing more than a pullback before another rally. As per the cryptocurrency market insights platform CryptoWatch, LTC trades in 87% correlation with Bitcoin (calculated over 30 days). What this means is that the crypto asset will mirror almost all price moves of its parent.
The BTC/USD 4-h chart shows buyers entering new positions after a brief selloff. However, things look shaky for LTC. Nonetheless, owing to the close correlation with Bitcoin, Litecoin might also experience buying pressure soon.
Read More: Litecoin bulls attempting 12% rally in a breakout move
Long-term investors may want to play the wait and see the game. For swing traders or short-term investors, it is advisable to exit all positions and book profits. Because on the 1-hour chart, the LTC/USD pair has dipped below the 20-day EMA and 20-day MA and testing support at the 50-day MA.
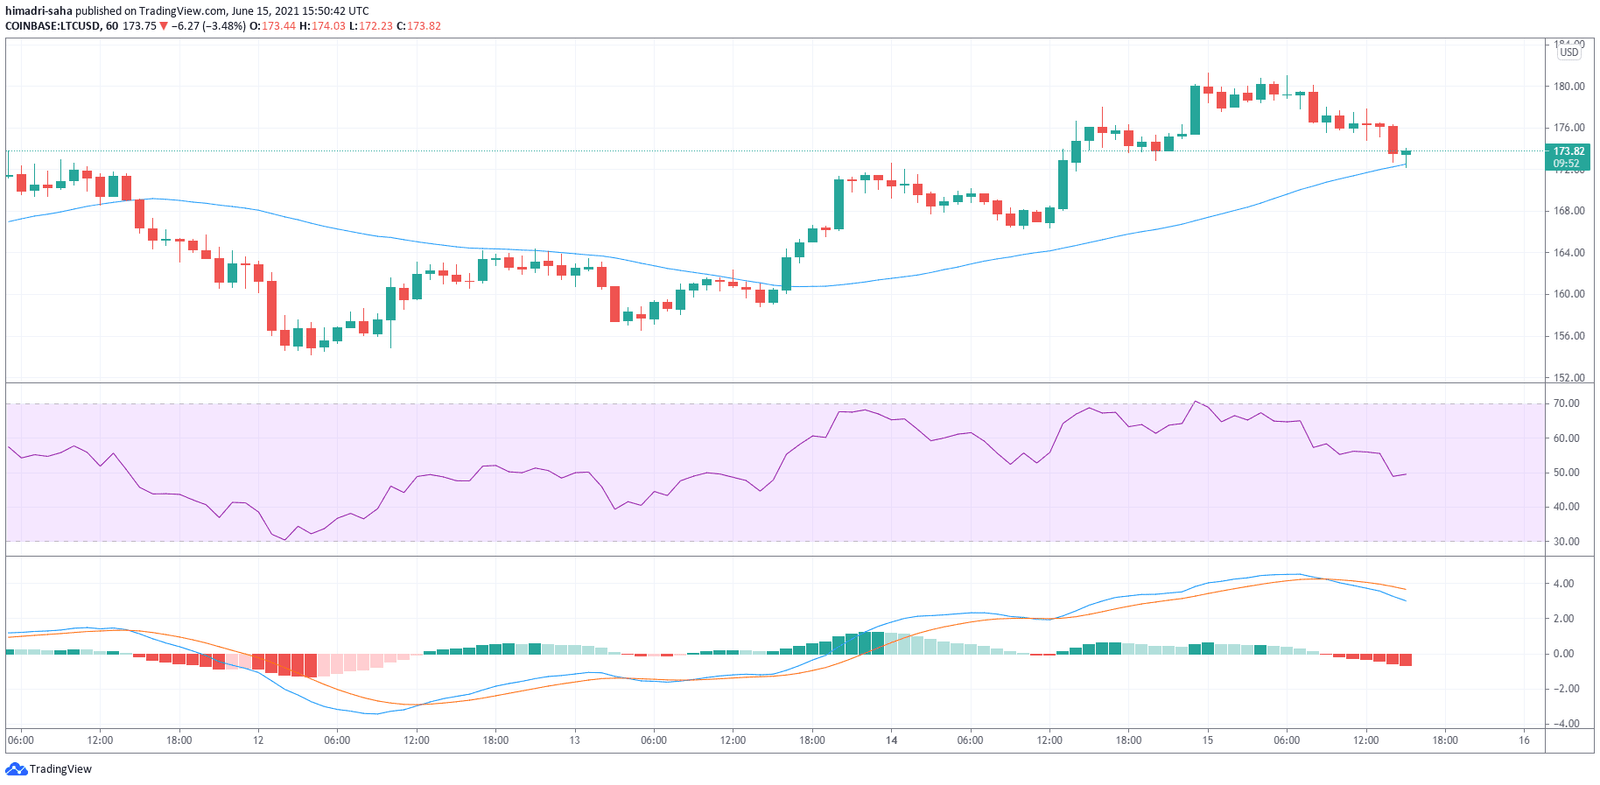
Although buyers have started showing up, it will take multiple successive green candles (with breakouts above 20-day EMA and 20-day MA) to confirm an uptrend.

… [Trackback]
[…] Here you will find 60201 additional Information on that Topic: coinchapter.com/litecoin-ltc-looks-bearish/ […]
… [Trackback]
[…] Info on that Topic: coinchapter.com/litecoin-ltc-looks-bearish/ […]
… [Trackback]
[…] Find More on on that Topic: coinchapter.com/litecoin-ltc-looks-bearish/ […]
… [Trackback]
[…] Find More here on that Topic: coinchapter.com/litecoin-ltc-looks-bearish/ […]