
NOIDA (CoinChapter.com)—XRP recently reached a multi-year high of $1.12, a price level the token last saw in Nov. 2021. The Ripple token’s recent rally drew cues from market optimism and favorable macro sentiment.
However, the rally has paused, with XRP price consolidating within a promising technical framework, potentially setting the stage for further gains. Notably, bullish patterns signal that XRP could maintain upward momentum if key support levels hold.
However, broader market conditions and internal metrics suggest a mixed outlook that warrants cautious optimism.
XRP Price Forms Bullish Technical Pattern
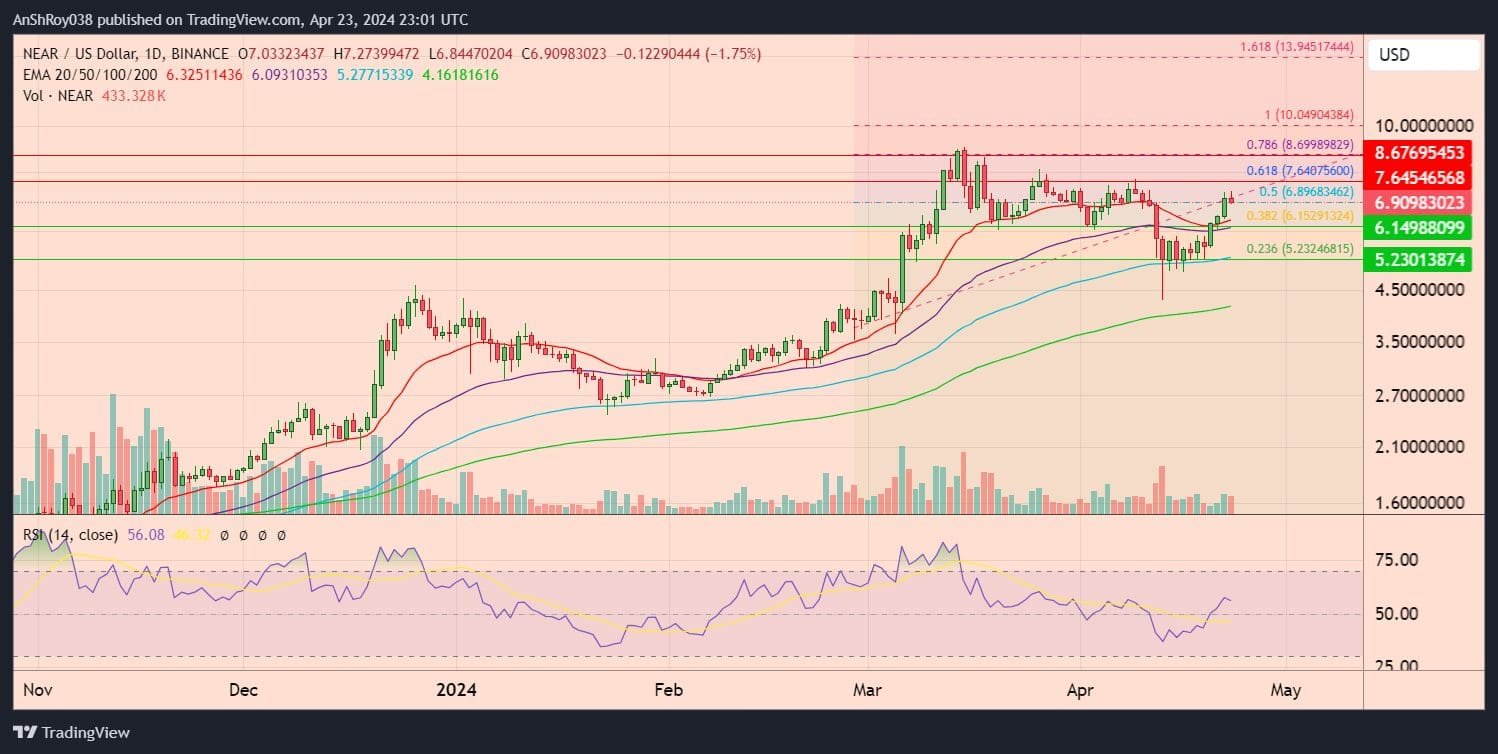
The XRP USD pair has formed a bullish technical pattern called the ‘bull pennant,’ which could attract more buyers to the market should the token show signs of a bullish breakout.
The bull pennant pattern is a classic technical indicator suggesting the potential continuation of an existing upward trend. This pattern emerges when the price of an asset consolidates within a narrowing range after a strong upward move, creating a shape that resembles a small, triangular flag.
The pattern is characterized by two converging trendlines connecting high and low prices during consolidation. During this phase, trading volume usually decreases, signaling market indecision as traders await the next significant move.
For the bull pennant to confirm a bullish continuation, a breakout above the upper trendline is essential, ideally accompanied by a substantial increase in volume. This volume surge indicates robust buying pressure, reinforcing the likelihood of continued upward momentum.
However, if the breakout occurs without a significant increase in volume, the risk of a false breakout rises. In this case, the price may fall back into the pennant’s range, potentially signaling a reversal.
According to technical analysis principles, if the XRP USD pair successfully breaks out of the bull pennant, it could theoretically target a level nearly 123% higher than its current price, suggesting a potential rise to approximately $2.5.

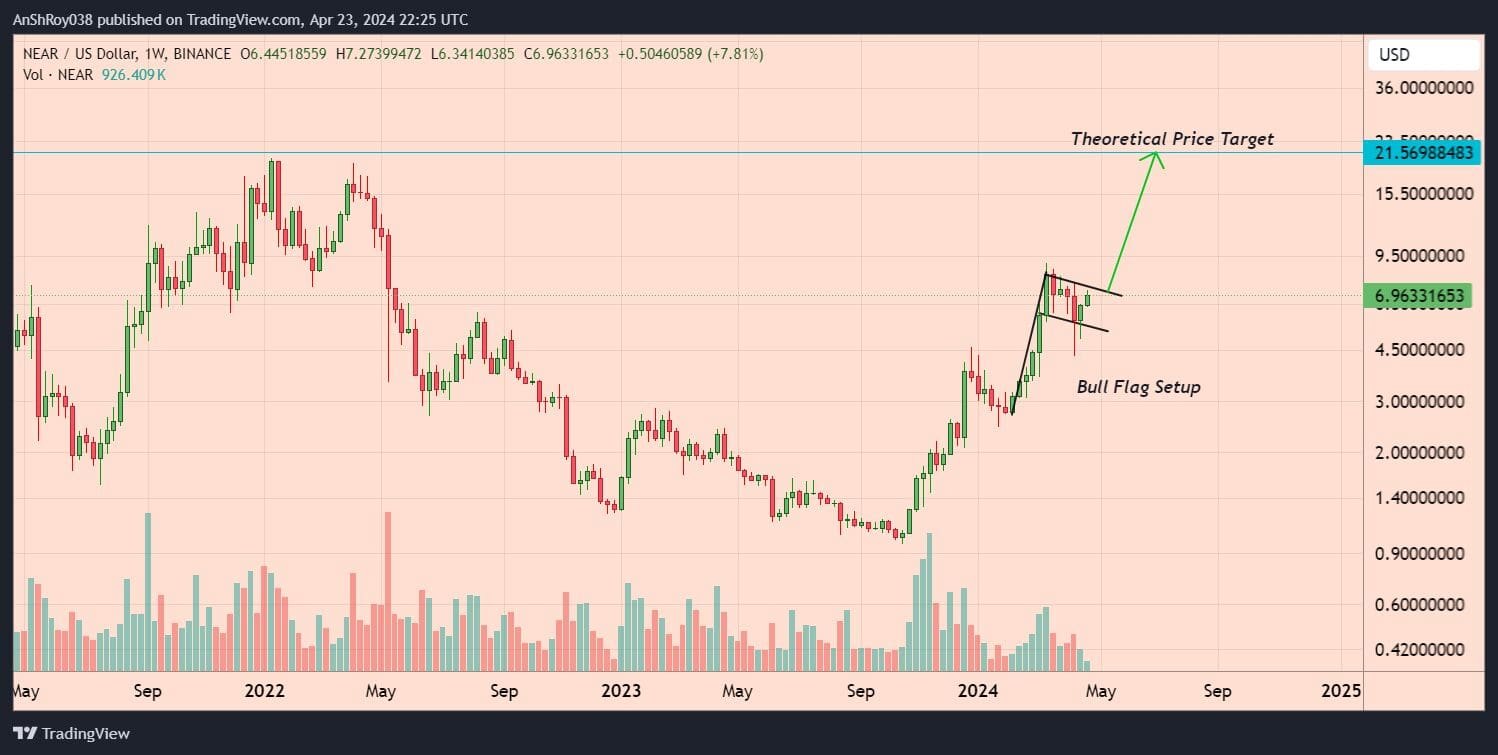
Interestingly, the XRP price has also broken out of a nearly seven-year-long symmetrical triangle pattern. The Ripple token successfully broke out from a similar pattern in 2017, which saw XRP prices rally over 45,640% in the subsequent bull run.
The current pattern also has a ridiculous theoretical price target near $18, a jump of 2,590% from current levels. However, XRP price would need to flip resistance near $1.5 and $1.9 before bulls can even dream of reaching the projected target.
Bearish Factors Threatening Price Rally
Despite bullish developments, XRP faces significant bearish cues that could derail its rally. XRP’s open interest-weighted funding rate has declined, suggesting waning bullish sentiment among leveraged traders.
As funding rates turned negative in mid-November, traders paying to maintain long positions indicated skepticism about XRP’s sustained upside.
Additionally, open interest in XRP futures contracts has plateaued near $1.8 billion after a steady climb in recent weeks.
This stagnation suggests a limited inflow of fresh capital into XRP markets, raising concerns about the rally’s sustainability. Historically, stagnant open interest coupled with falling funding rates indicates growing uncertainty, often preceding price pullbacks.
The price consolidation around $1.12 could also reflect exhaustion after XRP’s strong rally as speculative traders lock in profits. Market sentiment appears fragile, with XRP struggling to maintain dominance amid criticisms of Ripple’s alignment with centralized digital currencies (CBDCs).
Moreover, XRP’s overbought relative strength index, both on the weekly and daily charts, could increase selling pressure against the token. Overbought RSI levels often precede trend reversals, leading traders to perceive the occurrence as a sell signal.

… [Trackback]
[…] Find More to that Topic: coinchapter.com/ripple-xrp-hits-multi-year-high-forms-bullish-pattern-but-correction-looms/ […]
… [Trackback]
[…] Information to that Topic: coinchapter.com/ripple-xrp-hits-multi-year-high-forms-bullish-pattern-but-correction-looms/ […]