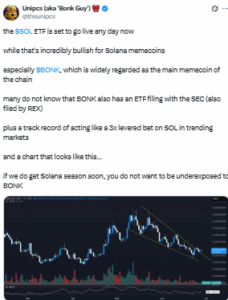
Crypto trader Unipcs recently said BONK often acts like a 3X version of Solana’s price when the network trends higher. He points to the pending Solana ETF filings as a possible catalyst for BONK’s next big move.
In June 2025, VanEck and 21Shares filed for the first Solana spot ETFs in the United States. These filings came after the Securities and Exchange Commission (SEC) approved spot Bitcoin ETFs in January 2024, following more than a decade of rejected applications. For the final round that cleared, Bitcoin ETF filings took about six to seven months from submission to approval.
Ten Bitcoin spot ETFs have traded since January 11, 2024. That same month, major U.S. exchanges — Nasdaq, CBOE, and NYSE Arca — filed additional 19b-4 forms with the SEC to launch options trading tied to the new spot Bitcoin ETFs, according to public notices on their websites.
Ethereum spot ETFs cleared much faster than Bitcoin’s early attempts — within about five to six months after final filings. Solana’s filings are now the next test of whether the SEC will expand crypto exposure to new layer-1 blockchains.
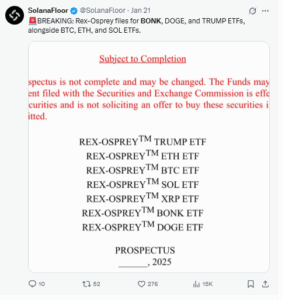
Apart from the Solana ETF filing, BONK also has an ETF plan in progress. A draft prospectus from Rex-Osprey lists a ‘REX-OSPREY™ BONK ETF’ alongside other crypto funds. The document shows BONK could follow Solana’s path if investor demand grows and approvals move forward.”
BONK’s Price Ties Closely to Solana Moves
Unipcs described BONK as behaving like a “3X levered bet on SOL in trending markets.” This claim matches past price action, where BONK has outpaced Solana’s percentage gains during strong rallies. For instance, when Solana rose from about $20 to more than $100 between October and December 2023 — a gain of 400% — BONK price jumped from roughly $0.000002 to over $0.000030, an increase of about 1,400%.
At the time of writing, Solana trades near $140, up around 12% in the past 30 days. BONK trades near $0.00001399 with a market cap of about $1.24 billion and daily volume close to $169 million.
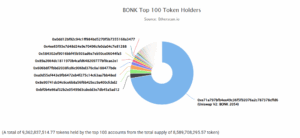
BONK has a maximum supply of 88.8 trillion coins, with about 80.3 trillion already in circulation. Data from Solscan shows the meme coin has more than 943,000 holder addresses. On-chain metrics also reveal the top 10 wallets control about 20% of supply, it means that large holders can impact short-term price swings.
Can $BONK Break Its Downtrend?
BONK’s daily chart shows the meme coin trading inside a descending channel. The price has continued to form lower highs and lower lows, confirming a short-term downtrend.
Immediate support sits around $0.0000132–$0.0000135, a level tested multiple times in recent sessions. If this zone fails, BONK risks dropping toward $0.0000125–$0.0000130.
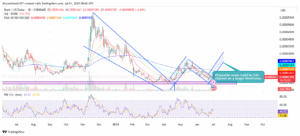
On the upside, resistance sits near $0.0000150–$0.0000157, where the channel’s top boundary and the 50-day exponential moving average (EMA) meet. A stronger resistance band stands around $0.0000170–$0.0000180, which aligns with the 100-day EMA and past supply levels.
The Relative Strength Index (RSI) remains near 40–45, pointing to neutral momentum — not oversold or overheated. Daily trading volume is lighter than the March–May breakout, showing no clear sign of new large accumulation yet.
If BONK breaks above $0.0000150 on a confirmed daily close with strong volume, the downtrend may flip, with the next logical upside target near $0.0000170–$0.0000180 — about 20–30% higher than current levels. If momentum stays weak and BONK fails to hold support, it could trend lower to $0.0000120 or below.
For now, BONK’s near-term direction depends on whether the Solana ETF gains momentum and if retail traders return to meme coins in the coming weeks.
The broader meme coin market is also down. Dogecoin (DOGE) trades near $0.1610, down 2.84% in the last 24 hours. Shiba Inu (SHIB) holds around $0.0000112, also slightly lower. Bitcoin dominance sits near 65%, indicating capital stays concentrated in large-cap assets rather than flowing into riskier meme tokens.
