
Dogecoin (DOGE) has formed a bullish double bottom pattern on the daily chart, but analysts warn the price may require a third attempt to break the $0.28–$0.30 resistance zone.
Trader Tardigrade identified the structure as a classic double bottom, with two rounded lows between April and July. The neckline sits around $0.28, just under the 0.786 Fibonacci retracement level from the April 2024 high ($0.485) to the January 2025 low ($0.0659). While the pattern indicates bullish reversal potential, price has failed to close convincingly above the neckline resistance.
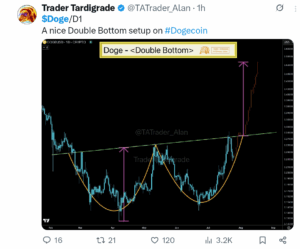
DOGE traded at $0.231 on July 25, after pulling back from a local high of $0.288. According to analyst Alek Carter, the resistance level has held firm. “We’re not going to break this strong resistance in two touchups. We need at least three to push through,” he wrote, noting that DOGE has repeatedly failed at this range since Q2 2024.
Technical Indicators Show Uptrend, But Momentum Weakening
DOGE to USD is currently trading above all major exponential moving averages (20D, 50D, 100D, 200D), showing that the broader trend has turned bullish. However, the MACD histogram is flattening. The MACD line (0.0186) remains only slightly above the signal line (0.0172), showing that upside momentum is weakening after the recent rally.
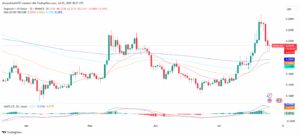
The Bollinger Bands on the daily chart also confirm this view. Price tapped the upper band near $0.28 and is now pulling back toward the midline at $0.22. Meanwhile, the Relative Strength Index (RSI) is at 52.9 — a neutral level that leaves room for further upward or downward movement.
Volume analysis shows that despite the breakout attempt, trading volume has not significantly expanded. On-Balance Volume (OBV) is rising, with the daily reading near 155B and the monthly chart showing a peak at 296.68B. However, these levels remain below the volume spikes seen during past major breakouts, such as the ones we saw in March 2024 and November 2023.
On-Chain Data Suggests Moderate Support for Dogecoin, Not Full Commitment
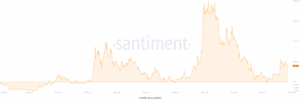
The Market Value to Realized Value (MVRV) ratio for Dogecoin currently sits around 51%. This metric compares the market price of DOGE to the average acquisition price across the network. This means the average holder is sitting on a 51% unrealized profit. While not overheated, this level is above the neutral range and suggests the market is not in an accumulation phase. Historically, DOGE tops have occurred when MVRV exceeds 100%, and local bottoms formed near -10% or lower.
Daily active addresses are around 58,000, and the 30-day average sits at 1.8 million. These figures remain well below peak activity observed in late 2023, when DOGE volume surpassed 8 billion tokens per day. Current network engagement is stable, but not showing breakout-level expansion.
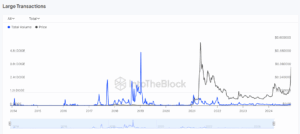
Whale activity also remains subdued. IntoTheBlock data shows no significant rise in large transactions over $100K in recent weeks. In past cycles, DOGE breakouts to $0.40 and above were driven by increased whale accumulation and large transfers. That signal is currently missing from the on-chain picture.
Dogecoin’s Make-or-Break Level is $0.30
For the double bottom pattern to play out fully, DOGE must decisively break the neckline resistance and sustain a close above the $0.30 psychological barrier. This range aligns with the 0.786 Fib level at $0.2815, which rejected price twice before — in March 2024 and again in July 2025.
If DOGE successfully closes above $0.30 on high volume and rising OBV, the next key resistance levels would be $0.325 at the 0.618 Fibonacci retracement, followed by $0.355 at the 0.5 level, and then $0.424, which aligns with the 0.236 Fib. Each of these levels previously acted as resistance or support during the 2024 price cycle. They could pose challenges if momentum weakens during the breakout attempt. These levels acted as both support and resistance during previous bull moves.
If DOGE fails again at resistance, a short-term correction toward $0.22 or even $0.20 is possible, which aligns with the 20-day EMA and Bollinger Band midline. This would support Alek Carter’s view that Dogecoin’s price may consolidate before a breakout attempt on the third touch.
