
The U.S. Securities and Exchange Commission (SEC) and the Commodity Futures Trading Commission (CFTC) issued a joint statement on September 2. They confirmed that platforms such as Designated Contract Markets (DCMs), Foreign Boards of Trade (FBOTs), and National Securities Exchanges (NSEs) are not barred from facilitating trading in certain spot crypto asset products. The clarification paves the way for pending applications tied to XRP and other digital assets.
The announcement marks a policy adjustment that could streamline regulatory review. Observers note that this shift aligns with a broader push to expand investor access to digital assets through regulated exchange-traded products.
XRP ETF Deadlines Approach
The SEC faces multiple deadlines between October 18 and November 14 to rule on spot XRP ETF filings. Data from prediction market Polymarket shows approval odds at 87%. Industry analysts, including Nate Geraci and Eric Balchunas, argue the probability may be even higher based on recent regulatory signals.
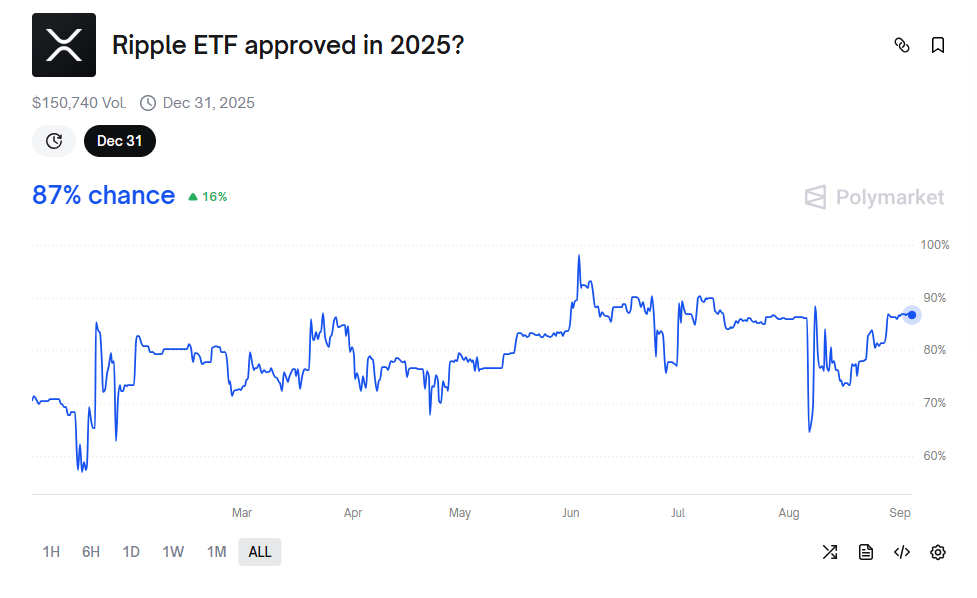
Market participants say approval would represent a significant structural milestone for XRP’s integration into mainstream financial markets. The outcome could also establish precedent for how regulators treat other altcoins under consideration.
Meanwhile, Treasury strategies are also evolving around the XRP Ledger. VivoPower and Doppler Finance recently allocated $30 million in XRP for yield management. The investment highlights the growing role of XRP in corporate balance sheets.
Analysts view the move as part of a trend where firms use blockchain-based assets to diversify treasury holdings while maintaining liquidity. The shift follows broader adoption of digital assets for institutional yield strategies.
Options Market Expands Beyond Bitcoin
Derivatives activity has surged across altcoins, with XRP and Solana drawing increasing demand from institutional desks. Data shows strong growth in XRP options trading volumes in the fourth quarter. The expansion indicates that market infrastructure for altcoin derivatives is maturing, offering hedging tools previously concentrated in Bitcoin and Ethereum.
Industry sources say the spread of options trading across multiple blockchains signals deeper integration of crypto assets into financial markets. It also reflects investor appetite for structured products tied to alternative digital assets.
XRP Faces Key Support Test at $2.74
Analyst Ali highlighted that XRP is approaching a critical support level at $2.74. The chart he shared on September 3 shows the token trading inside a descending triangle, with repeated tests of lower boundaries signaling mounting pressure.
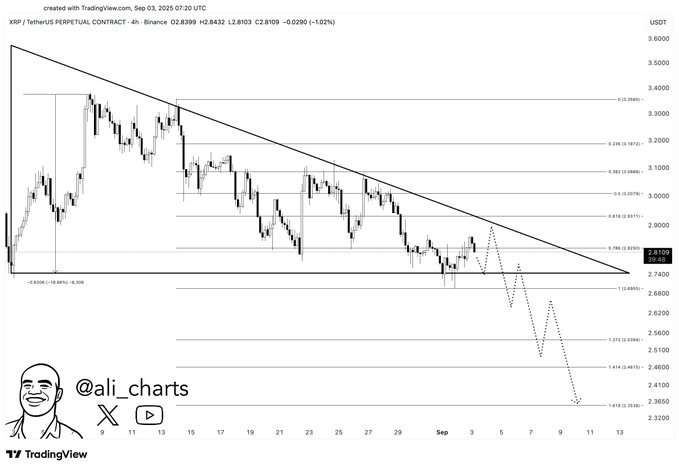
Technical indicators suggest that holding the $2.74 zone is vital for maintaining stability. A decisive break below this level could trigger further downside momentum, exposing XRP to the $2.35 range. The projected path outlined by Ali points to a potential multi-step decline if support fails, aligning with Fibonacci extension levels visible on the chart.
Trading volumes remain concentrated near recent lows, reflecting cautious market sentiment. The descending trendline continues to cap upward moves, reinforcing the bearish outlook unless XRP can break resistance. As the consolidation narrows, market observers expect heightened volatility in the coming sessions.
XRP Forms Falling Wedge With Breakout Target
The XRP/USD chart, created on September 4, 2025, shows XRP trading inside a clear falling wedge pattern on the 4-hour timeframe. A falling wedge is a bullish reversal formation that appears when price makes lower highs and lower lows within converging trendlines, but gradually loses downward momentum. Once confirmed, the breakout usually drives price higher with strong momentum.
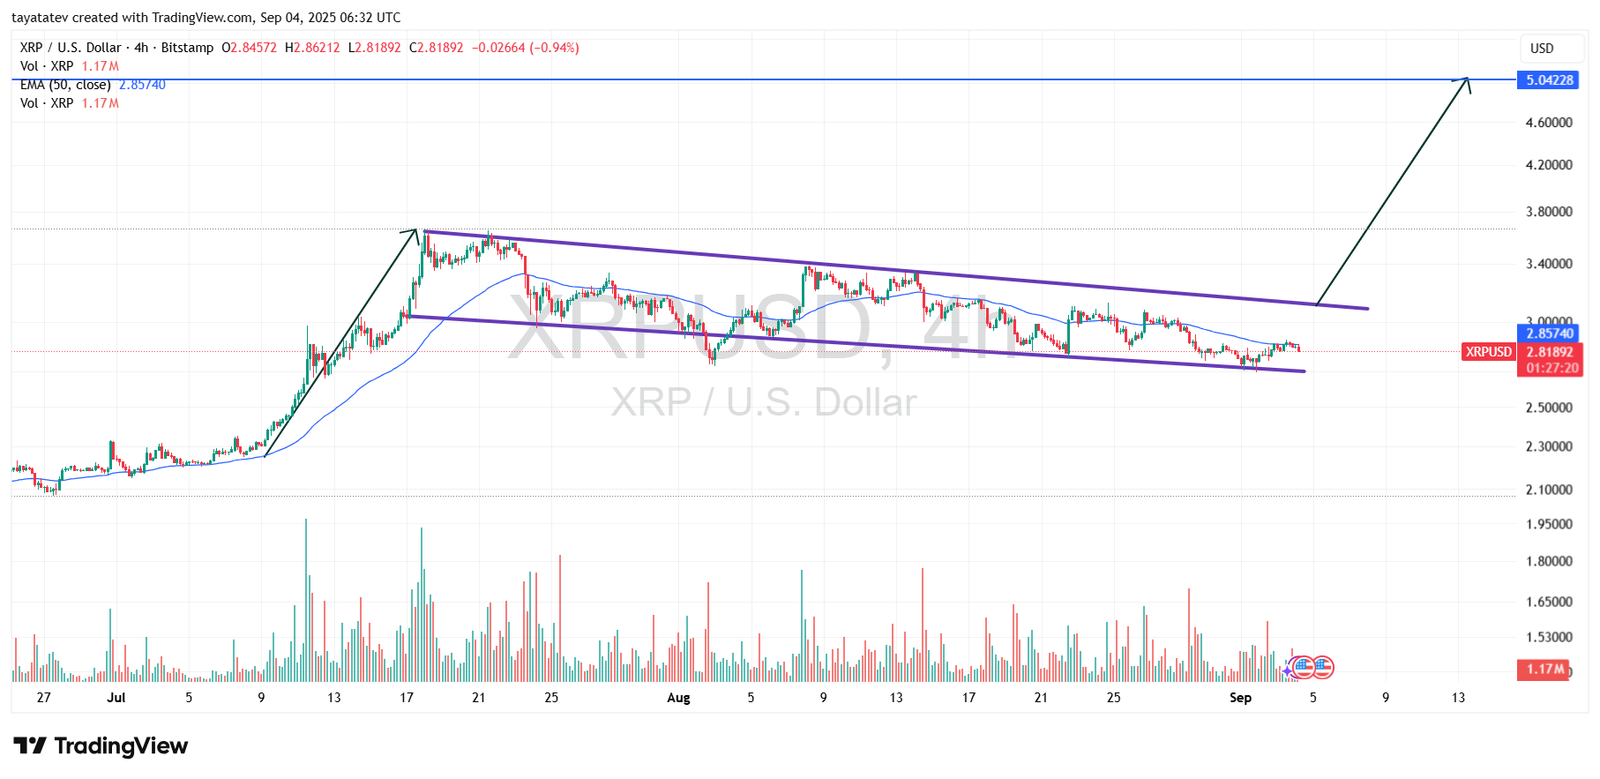
XRP is now testing the upper boundary of this wedge near $2.85. The pattern suggests that a breakout above resistance could unlock significant upside potential. If confirmed, the measured move projects a rally of about 78% from the current price of $2.81, which would push XRP toward the $5.04 level. This projection aligns with the Fibonacci extension plotted on the chart, strengthening the case for a bullish breakout.
Trading volume shows signs of contraction during the wedge’s formation, a typical precursor to a volatility surge. Meanwhile, the 50-period EMA, currently near $2.85, acts as a short-term pivot. Sustained closes above this moving average could add further momentum to the breakout. On the downside, failure to hold above $2.70 would delay the bullish scenario, keeping XRP trapped within the wedge.
The chart highlights a period of consolidation that may soon give way to a decisive move. With market sentiment supported by rising institutional interest and ETF discussions, the falling wedge pattern stands as a technical indicator pointing to XRP’s potential shift from prolonged consolidation to a strong upward phase.
XRP RSI Indicates Neutral Momentum
The chart, created on September 4, 2025, shows the Relative Strength Index (RSI, 14-period) for XRP on the 4-hour timeframe. The RSI line (purple) is currently at 47.09, while the moving average signal line (yellow) is at 50.70.
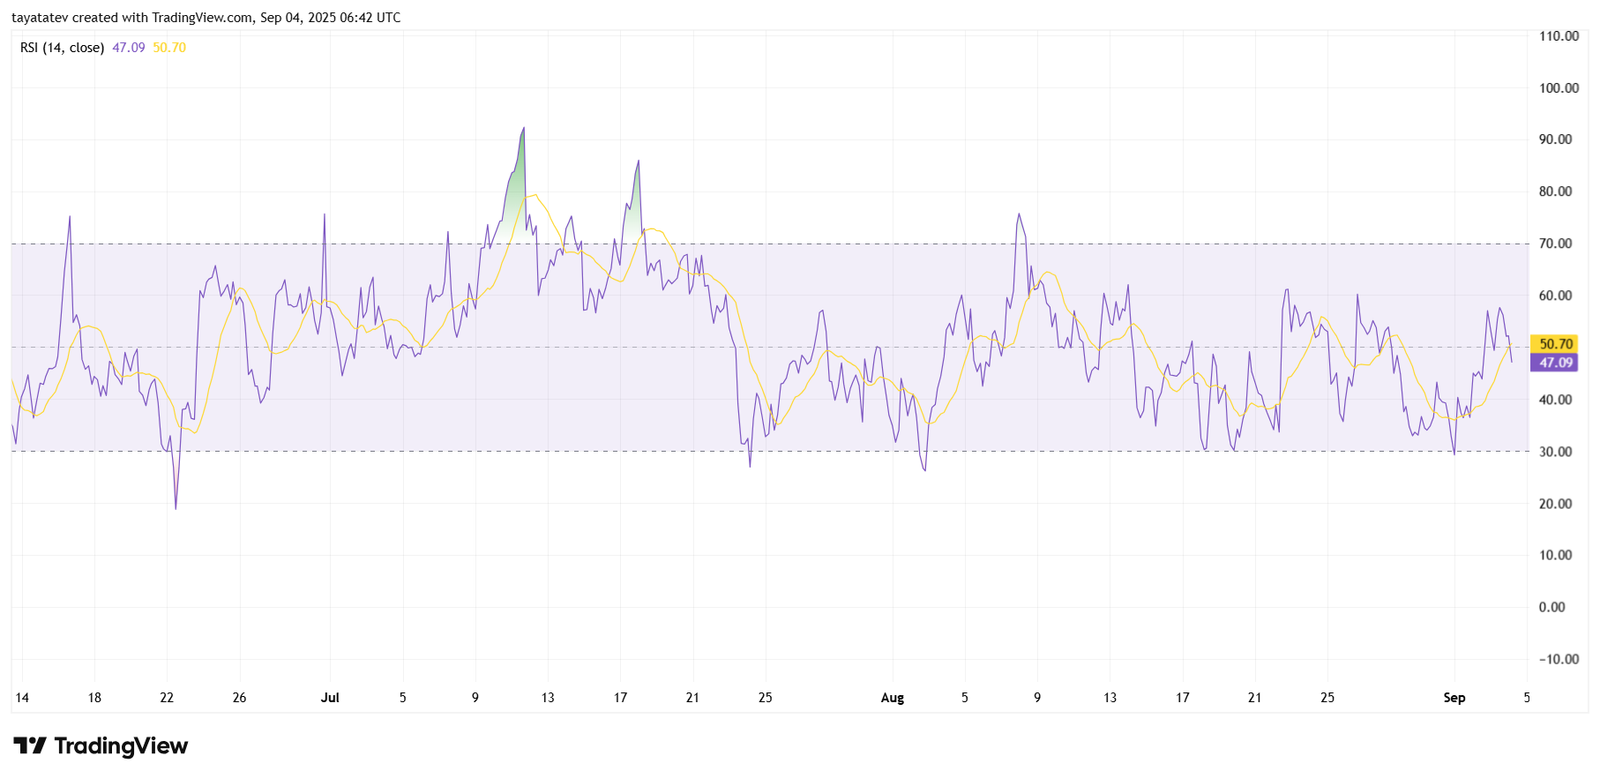
This positioning places XRP in the neutral zone, neither overbought (above 70) nor oversold (below 30). The RSI has been oscillating between 35 and 65 over recent weeks, suggesting a period of sideways trading. Momentum has weakened since late August, when the RSI briefly dipped into the oversold territory before recovering.
The crossover of the RSI below its moving average indicates short-term bearish pressure. However, the index remains close to midline levels, leaving room for a potential reversal if buying volume strengthens. Sustained moves above 55 would signal renewed bullish momentum, while a drop below 40 could open the way for further downside pressure.
Overall, the RSI shows that XRP is consolidating. The neutral reading reflects a balance between buyers and sellers, with traders awaiting a decisive breakout aligned with broader market catalysts.
