BIT Mining Pumps $300M Into Solana as Charts Signal 14% Breakout Potential

Tatevik Avetisyan
By Tatevik Avetisyan 7 Min Read
BIT Mining Pumps $300M Into Solana as Charts Signal 14% Breakout Potential

BIT Mining Ltd. announced a plan to invest between $200 million and $300 million into Solana, triggering a sharp rally in its U.S.-traded shares. The stock more than doubled following the news.

The company confirmed it will begin building a Solana-based treasury by converting its current crypto holdings into SOL. This shift marks a major change in strategy for the crypto mining firm.

- Advertisement -

According to BIT Mining, the investment will be raised in stages and fully directed toward acquiring Solana coins. In a public statement, the firm described this transition as a key step in its long-term roadmap.

“This is a strategic shift,” the company said, “as we expand into the Solana ecosystem and push toward future growth.”

BIT Mining CEO Xianfeng Yang added that Solana stands out as one of the “most dynamic and promising ecosystems” in blockchain. He emphasized the company’s goal to stay flexible and aligned with fast-changing market developments.

- Advertisement -

With this move, BIT Mining joins other firms increasingly turning to Solana’s infrastructure for treasury management and ecosystem access. The company has not yet disclosed a timeline for completing the full treasury build.

Solana Breaks Above Ascending Channel, May Climb 14% Higher

Sol/USDT created an ascending channel pattern between June 23 and July 18, 2025. An ascending channel is a bullish continuation pattern. It shows the price moving upward between two parallel rising lines—one marking support and the other resistance.

Solana / U.S. Dollar – 4h – COINBASEChart Source: TradingView.com
Solana / U.S. Dollar – 4h – COINBASE․ Chart Source: TradingView.com

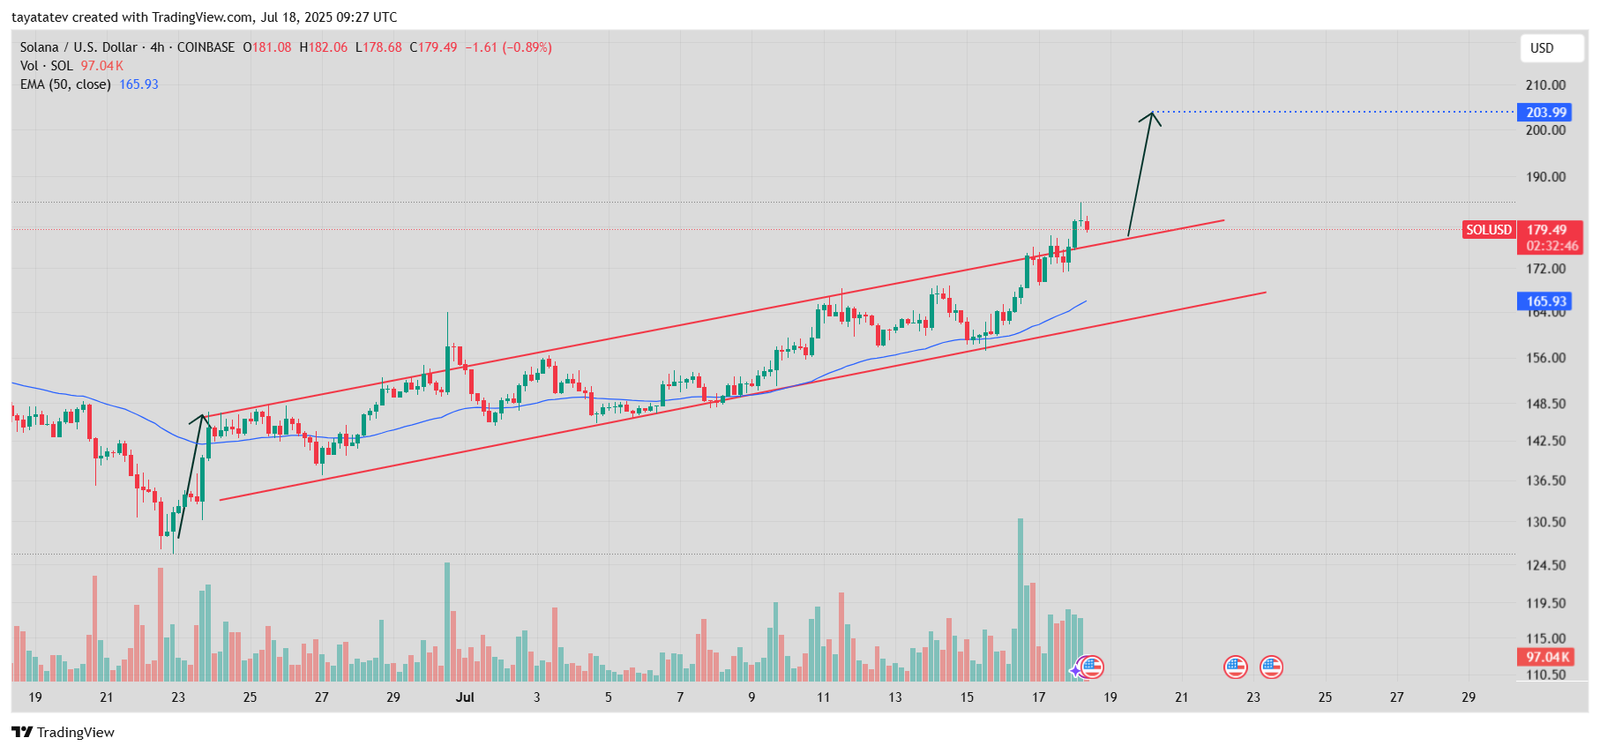
On July 18, Solana’s price reached $179.49. The chart shows that the price broke above the upper red trendline, which had acted as resistance during the entire pattern. This breakout places the price 2% higher than the top of the channel, suggesting momentum is building.

If this breakout holds, Solana could gain 14% from its current price, which would take it to around $203.99. This level is marked on the chart as the possible next target.

The blue line on the chart shows the 50-period Exponential Moving Average (EMA). This line currently sits at $165.93 and continues to rise. A rising EMA supports the idea that the trend is still moving upward.

The volume bar at the bottom shows consistent trading activity, which helps confirm that the breakout is not weak.

In short, Solana has formed a bullish structure, broken above resistance, and may continue moving higher if the current trend continues.

- Advertisement -

MACD Chart Confirms Strong Buyer Momentum in Solana

The latest chart for Solana, created on July 18, 2025, uses the Moving Average Convergence Divergence indicator, also known as MACD. This tool helps track changes in momentum and trend direction in price movement.

MACD Indicator for Solana (SOL/USD)Chart Source: TradingView.com
MACD Indicator for Solana (SOL/USD). Chart Source: TradingView.com

Right now, the MACD line is at 4.57, while the signal line is at 3.59. Because the MACD line is above the signal line, this shows that buyers are gaining control. At the same time, the green bars—called the histogram—are getting taller. These bars measure the distance between the two lines. When the bars grow, it means momentum is rising.

A few days ago, the MACD line crossed above the signal line. This kind of move is called a bullish crossover and often happens before a strong price increase. Since that crossover, both the MACD line and the signal line have continued to move upward.

This indicator confirms what the price chart already showed. Solana is in a strong uptrend, and the buyers are still leading. The growing momentum supports the recent breakout from the price pattern.

Solana RSI Signals Strong Buying Pressure

This chart, created on July 18, 2025, shows the Relative Strength Index, also called RSI, for Solana. RSI is a momentum indicator that measures the strength of price movements. It ranges from 0 to 100 and helps identify whether an asset is overbought or oversold.

 RSI Indicator for Solana (SOL/USD)Chart Source: TradingView.com
RSI Indicator for Solana (SOL/USD). Chart Source: TradingView.com

At the moment, the RSI value is 66.84. The yellow line, which represents the RSI moving average, is at 65.79. These values sit just below the overbought threshold of 70. That means Solana is showing strong buying momentum, but it has not yet entered the overbought zone.

When RSI rises and stays near 70, it suggests buyers are in control. Solana’s current RSI confirms that upward momentum is building and aligns with other indicators showing a bullish trend.

The chart also shows that RSI has been climbing steadily since the middle of July. If it continues to rise, Solana could soon enter the overbought zone, which often leads to short-term pauses or pullbacks.

For now, the indicator supports the view that the price may keep moving higher. Buyers are active, and momentum is clearly on the upside.

Solana SMI Chart Points to Ongoing Upward Momentum

This chart, created on July 18, 2025, shows the Stochastic Momentum Index (SMI) for Solana. The Stochastic Momentum Index helps identify short-term trend direction and speed. It ranges between positive and negative values, with readings above 40 often seen as bullish.

SMI Indicator for Solana (SOL/USD)Chart Source: TradingView.com
SMI Indicator for Solana (SOL/USD)․ Chart Source: TradingView.com

At the time of the chart, the SMI blue line stands at 58.87, and the signal line, shown in orange, is at 62.20. Both lines are clearly in the upper zone, showing that Solana still holds upward momentum. The recent price strength keeps the indicator in positive territory.

Although the blue line is slightly under the signal line, both lines are moving close together, with no sign of a sharp reversal yet. When the blue SMI line stays above zero and near or above the signal line, it confirms buying pressure.

This behavior shows that Solana remains strong in the current trend, with momentum still leaning in favor of buyers.

Tatevik Crypto Journalist CoinChapter

Tatevik Avetisyan

Tatev Avetisyan is a Markets Writer and Analyst at CoinChapter, covering cryptocurrency markets, policy, and regulation. With over seven years of experience in business and marketing development, she has spent the past two years specializing in digital assets and has authored more than 2,000 articles on crypto markets and regulatory developments. She contributes as a guest writer to leading industry publications and is a prominent Web3 advocate in Armenia through Web3Armenia. Her work reflects a broader focus on artificial intelligence and Web3 technologies. Tatev maintains a diversified crypto portfolio, with Bitcoin as her primary holding above CoinChapter’s $1,000 disclosure threshold.