YEREVAN (CoinChapter.com) — Gold reached an all-time high of $3,354 on April 16, while Bitcoin held firmly above $80,000. Despite a volatile macro environment, both assets outperformed traditional markets, according to Glassnode’s April 16 report.
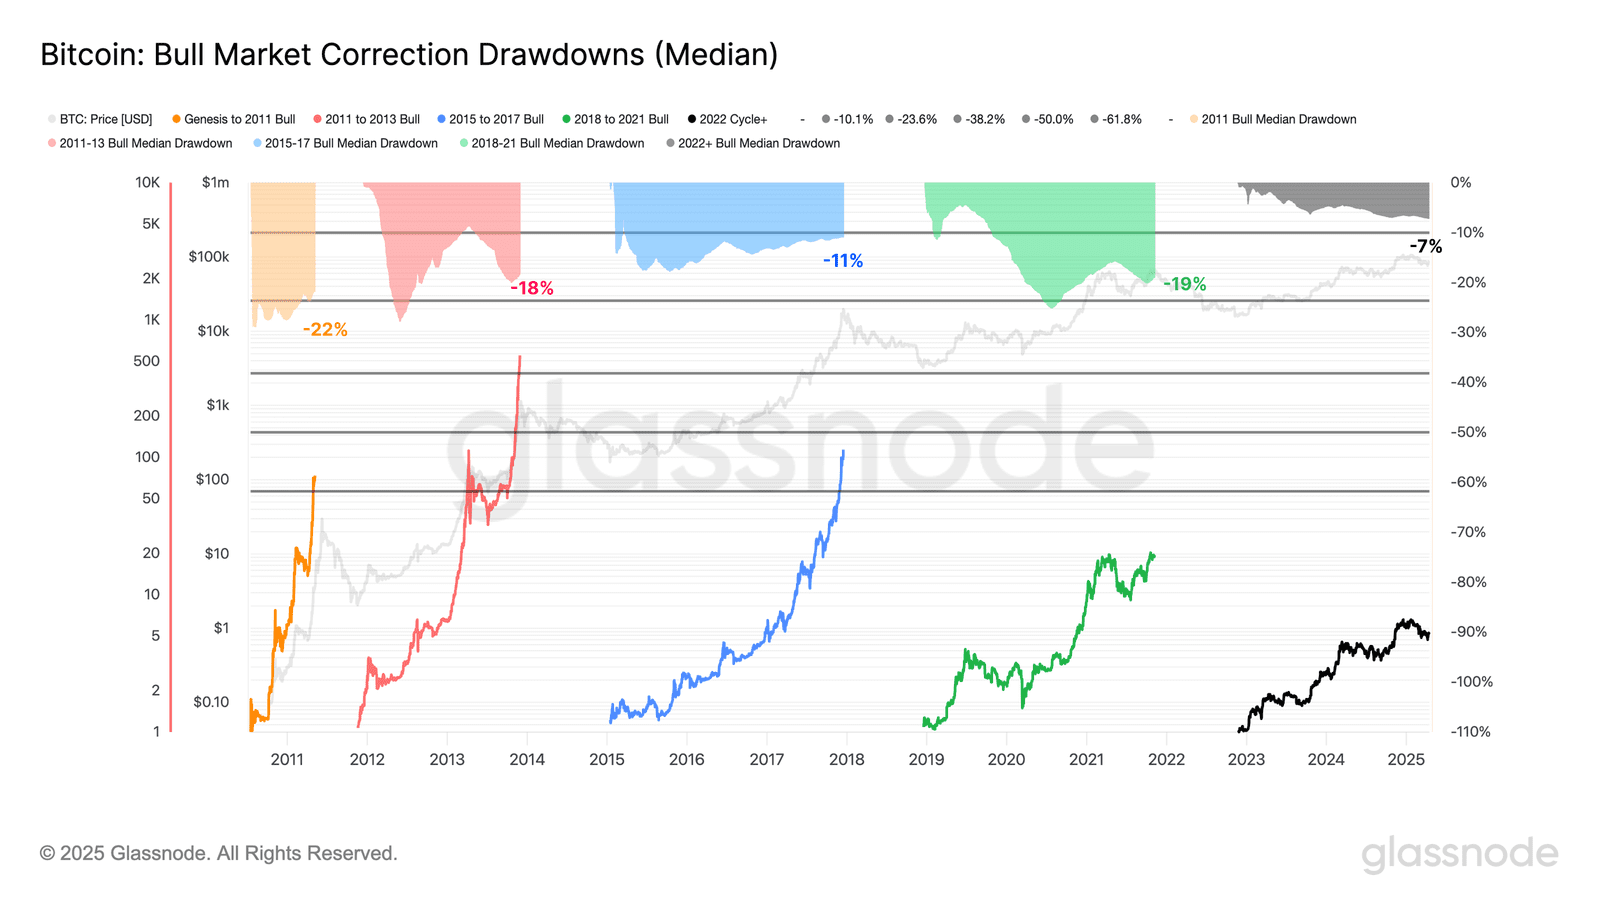
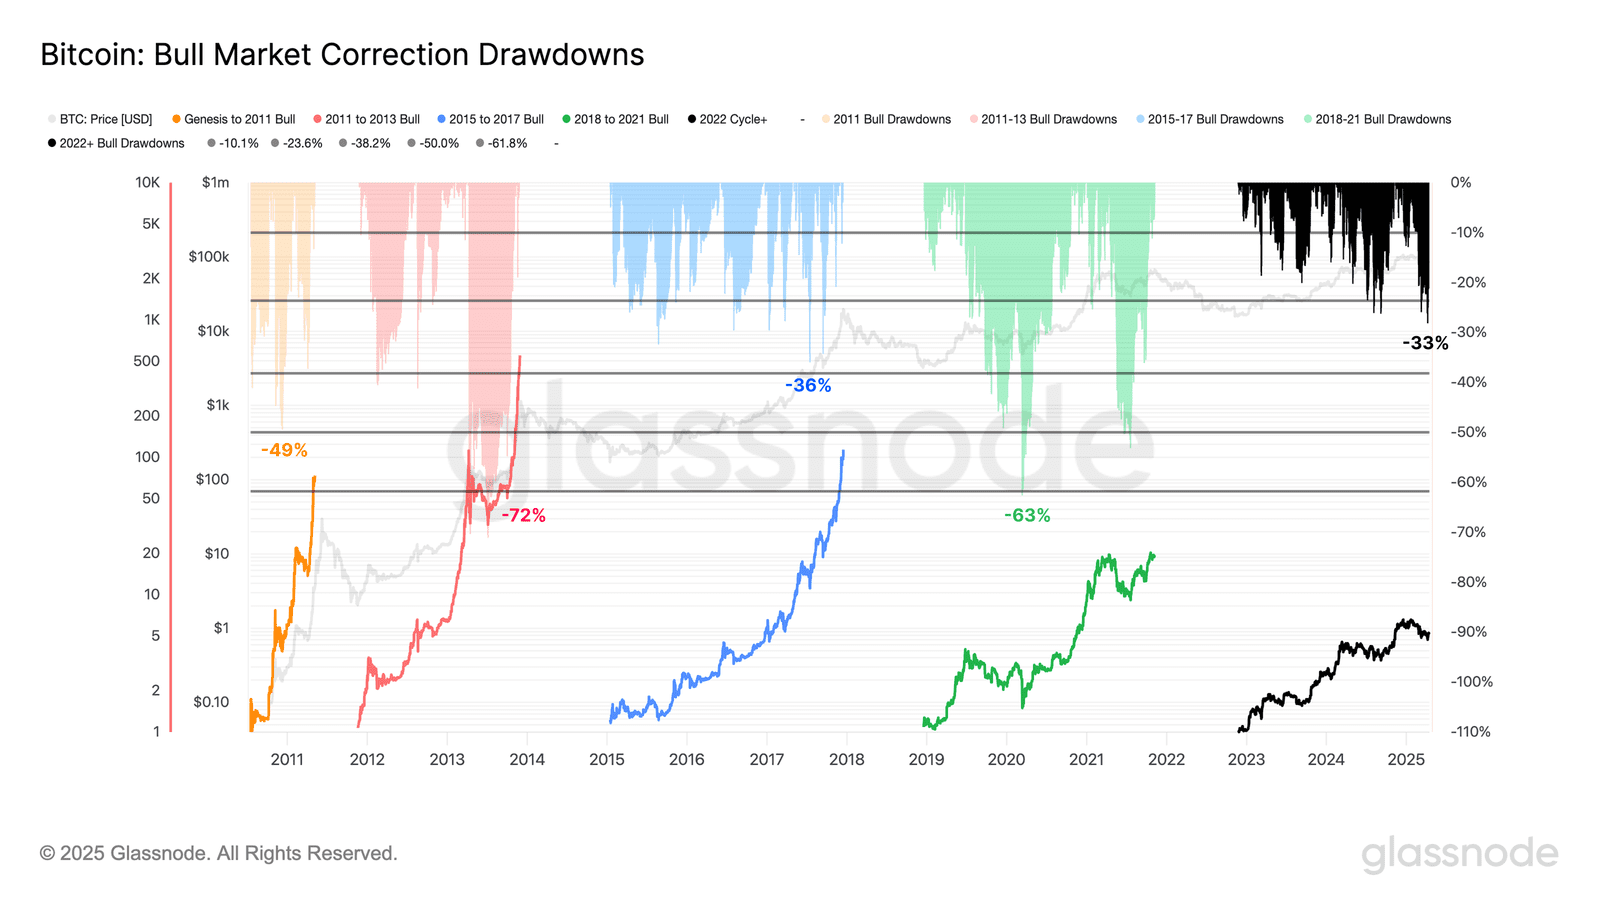
Bitcoin’s current cycle highlights a notable change in investor behavior. The deepest drawdown so far stands near 32%, far milder than prior bull markets, where corrections often exceeded 50%. Glassnode’s chart shows the median drawdown for the 2022+ cycle at just -7%, the shallowest on record.
- Advertisement -
In past cycles, such as 2011–2013 and 2018–2021, median pullbacks reached -22% and -19%, respectively. Now, investors appear more willing to absorb volatility rather than exit positions. That shift supports Bitcoin’s broader uptrend and suggests a more resilient market structure.
Bitcoin Bull Market Correction Depths Since 2011. Source: Glassnode
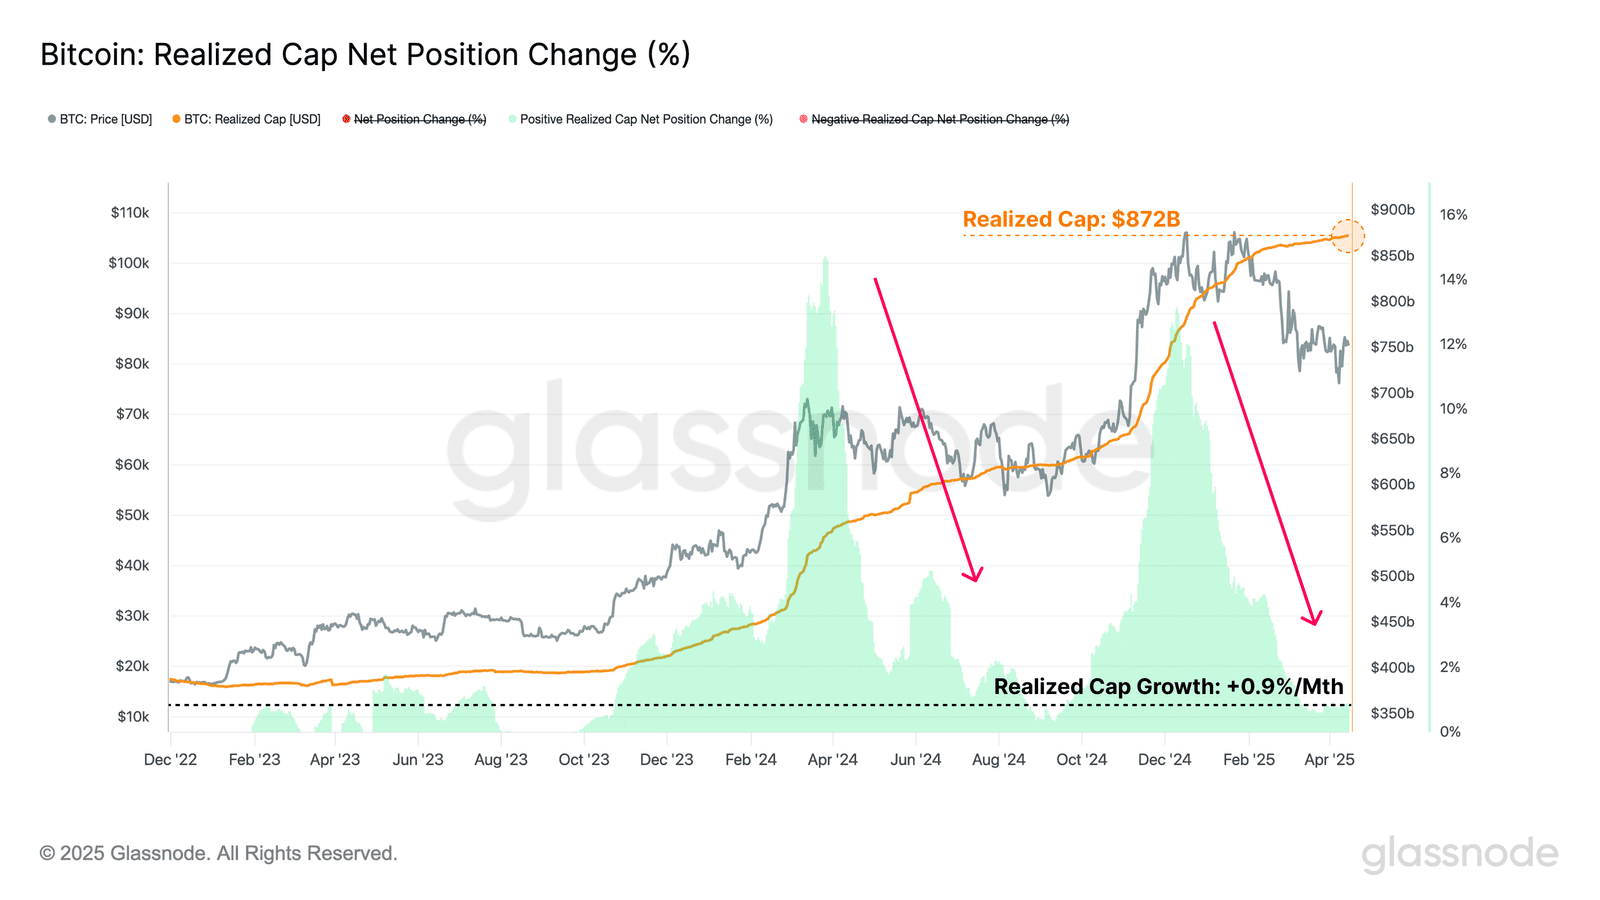
Since early 2023, each price correction has also been more controlled. Glassnode’s “Realized Cap Net Position Change” chart confirms consistent capital inflows, even during market weakness. The realized cap has steadily grown, reaching $872 billion by April 2025. It continues to expand at a rate of +0.9% per month, indicating that long-term investors are adding to positions rather than reducing exposure.
Bitcoin Realized Cap Net Position Trends 2023–2025. Source: Glassnode
Alongside this, realized profits and losses remain balanced, showing a neutral capital flow environment. This equilibrium limits sharp volatility and has helped Bitcoin consolidate above $80,000 with minimal drawdowns.
- Advertisement -
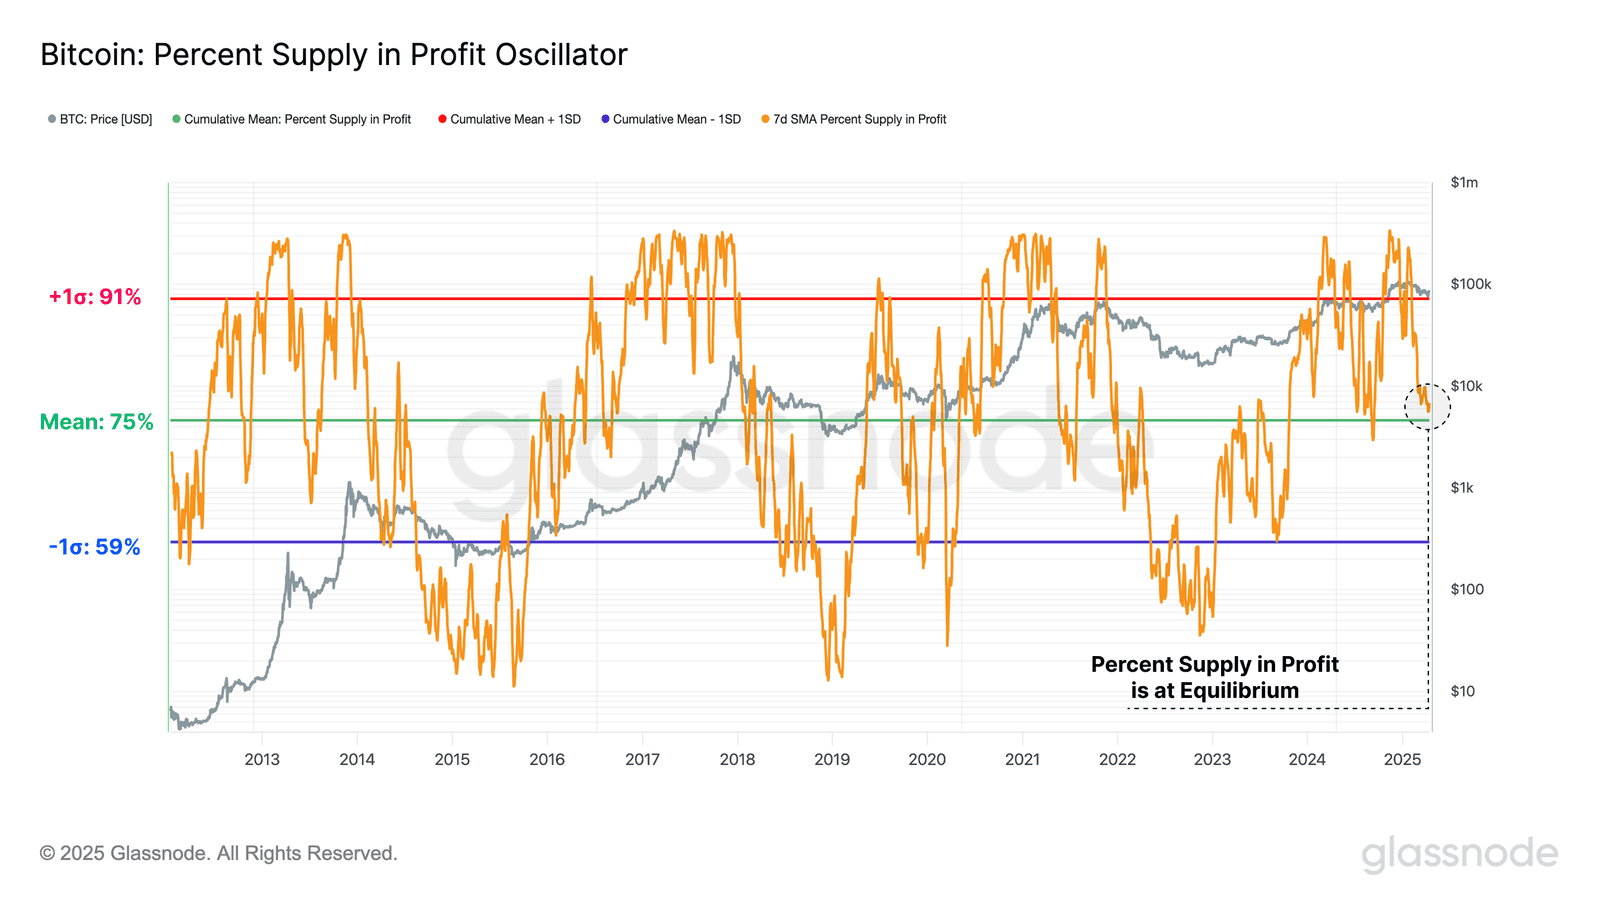
As of April 17, Bitcoin trades near $80,700. Glassnode’s “Percent Supply in Profit Oscillator” shows around 75% of the supply remains in profit—exactly at the long-term average. That level reflects investor confidence and reduces selling pressure. Earlier in the cycle, profit supply peaked at 91%, but the return to the mean suggests consolidation, not panic.
Bitcoin Supply in Profit Returns to Equilibrium. Source: Glassnode
Hard Assets Lead Amid Bond Market Stress
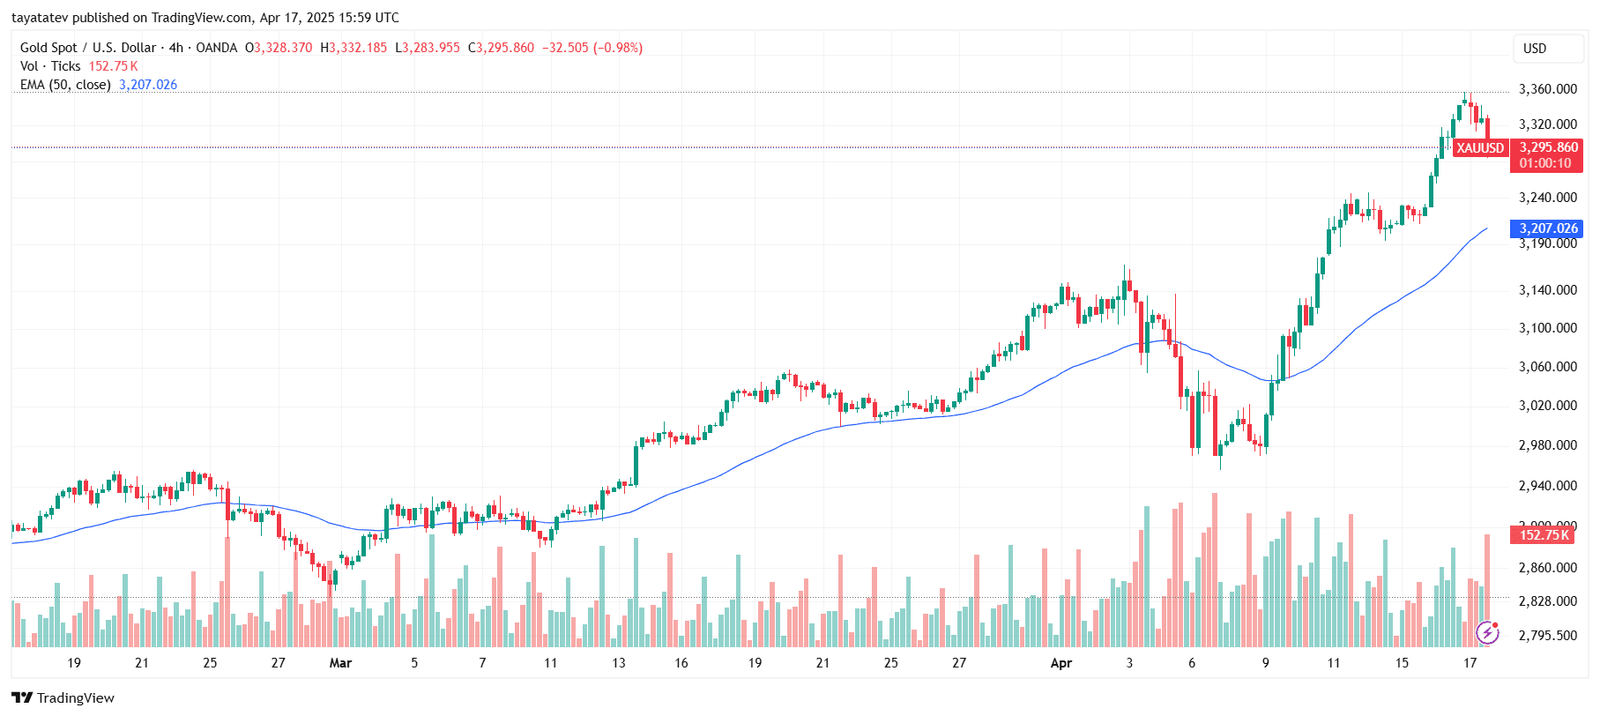
Capital continues to rotate into hard assets. Gold’s 26% year-to-date rise reflects growing demand for monetary hedges. Investors moved funds out of traditional markets as bond yields grew unstable. Between early 2025 and April, U.S. Treasury yields swung from 3.7% to 4.5%, triggering volatility in both bond and equity markets.
Gold Price Hits $3,354 in April 2025. Source: TradingView
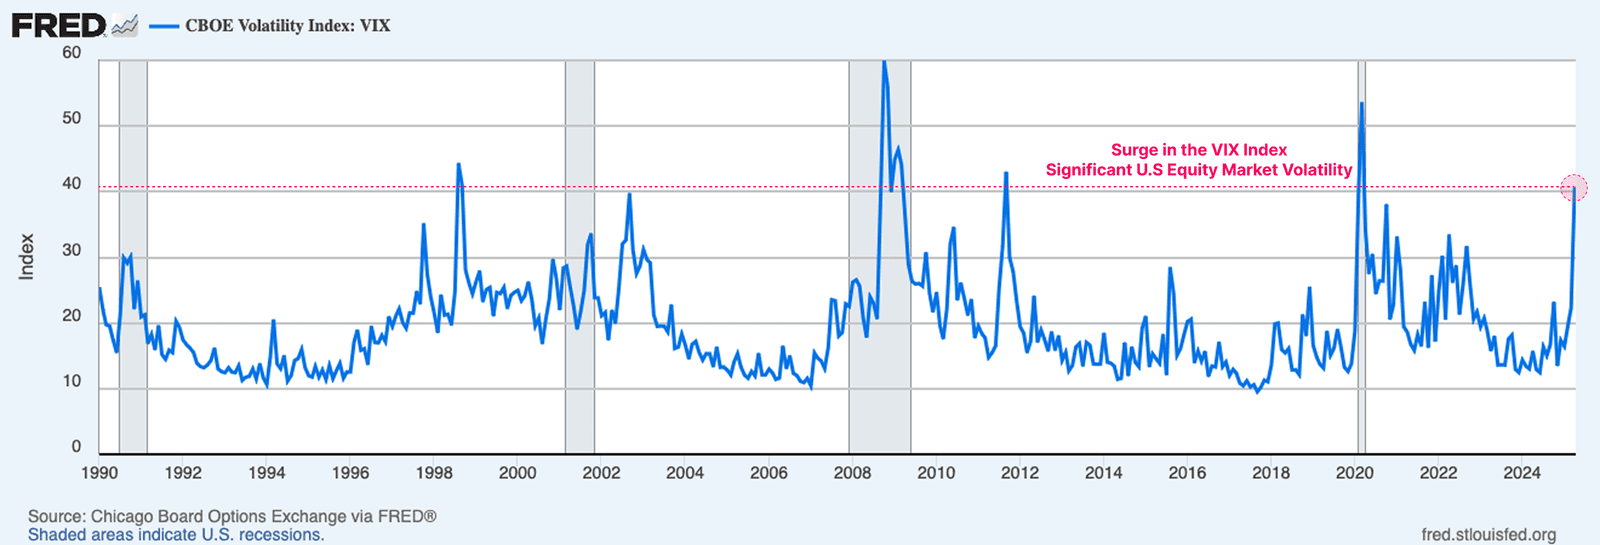
Glassnode noted that these fluctuations raised stress levels across markets. The MOVE Index, which tracks Treasury volatility, spiked sharply. Simultaneously, the VIX index reached levels not seen since past systemic shocks, such as 2008 and 2020. These developments reflect broader investor anxiety and shrinking liquidity conditions.
VIX Index Chart – Source: Glassnode
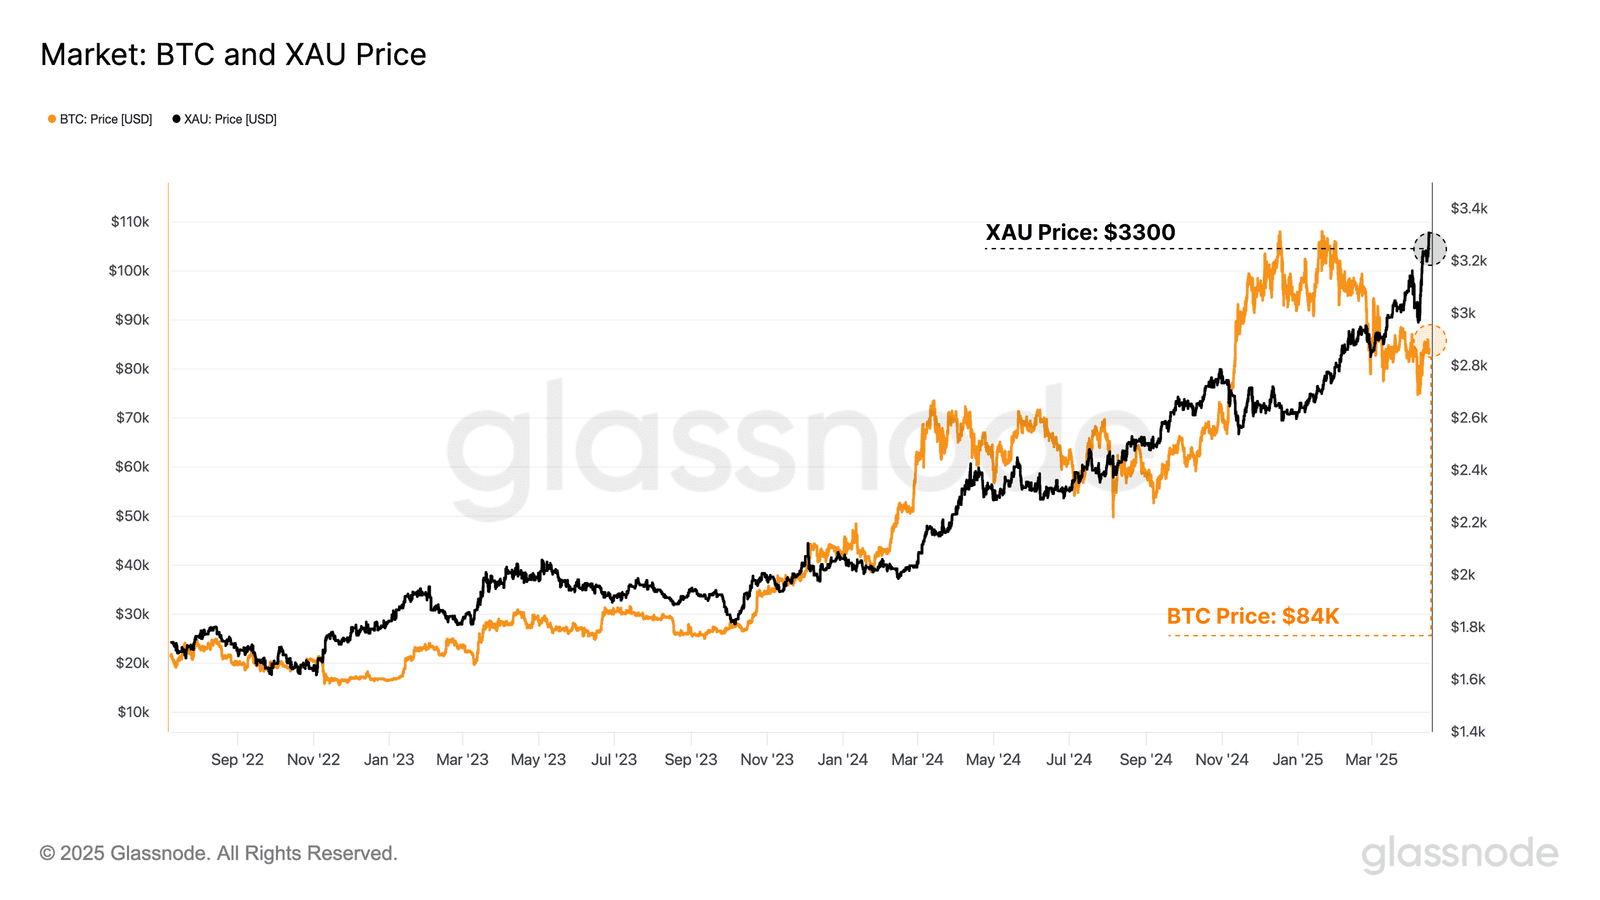
In response, capital shifted toward alternative reserves. Glassnode’s combined chart of Bitcoin and gold shows both assets surging as traditional benchmarks lost appeal. Bitcoin bounced from $75,000 to $85,000. Gold reached a historic peak of $3,354. Their parallel performance reinforces their growing role as global neutral stores of value, free from centralized monetary policy.
Bitcoin and Gold Reach Record Highs in 2025. Source: Glassnode
On-Chain Metrics Confirm Market Resilience
Glassnode’s supporting metrics reinforce the strength of Bitcoin’s current price range. The “Percent Supply in Profit Oscillator” confirms that most of the circulating supply remains above water. Meanwhile, the “BTC Realized Cap by Profit and Loss” chart shows that realized gains continue to outpace losses, even during short-term dips. Lastly, the “Volatility Adjusted Net Realized Profit/Loss” metric remains in positive territory. This indicates that long-term holders are not panic-selling, even in periods of broader market stress.
These on-chain signals reflect a maturing market, where accumulation and conviction outweigh short-term speculation.
Bitcoin Shows Milder Corrections Compared to Past Cycles
The “Bitcoin Bull Market Correction Drawdowns” chart displays a clear pattern of controlled pullbacks. Since the beginning of 2023, each correction has stayed within a 20% to 35% range, contrasting sharply with previous cycles where losses were much deeper. The data suggest that short-term sell-offs no longer lead to cascading liquidations.
- Advertisement -
Bitcoin Drawdowns Across Bull Cycles 2011–2025. Source: Glassnode
This resilience stems from a stronger holder base, better market structure, and increased institutional involvement. Rather than triggering fear-driven exits, recent dips have been met with accumulation. The presence of steady inflows, even during downturns, underscores Bitcoin’s growing role as a macro hedge. Combined with technical support and sustained demand, this has helped keep Bitcoin in a long-term uptrend.
Glassnode: Bitcoin and Gold Are Becoming Reserve Assets
Glassnode analysts noted a broader shift underway in global finance. As traditional monetary systems adjust to changing trade relationships and debt burdens, Bitcoin and gold are gaining traction as neutral, non-sovereign reserve assets.
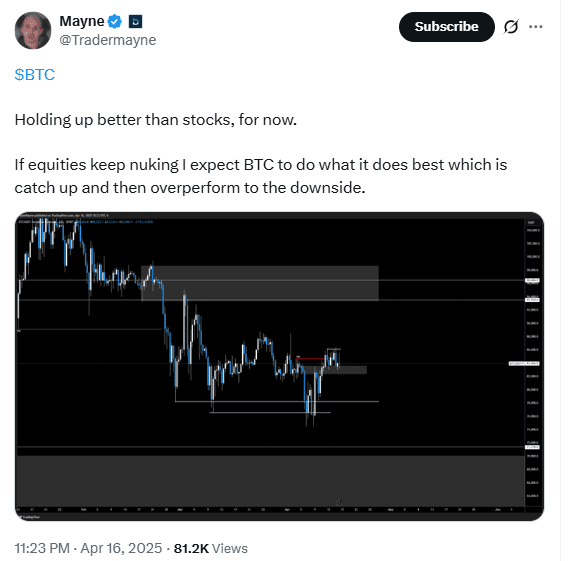
BTC vs Equities Breakdown Outlook. Source: Tradermayne on X
Their price performance in 2025 shows how investors seek alternatives to fiat-backed instruments. Bitcoin, in particular, benefits from growing acceptance among institutions and sovereign funds, positioning itself alongside gold as a hedge against inflation, currency devaluation, and fiscal uncertainty. As capital flows into these assets increase, their influence on portfolio allocations and macroeconomic strategy continues to grow.
Tatev Avetisyan is a Markets Writer and Analyst at CoinChapter, covering cryptocurrency markets, policy, and regulation. With over seven years of experience in business and marketing development, she has spent the past two years specializing in digital assets and has authored more than 2,000 articles on crypto markets and regulatory developments.She contributes as a guest writer to leading industry publications and is a prominent Web3 advocate in Armenia through Web3Armenia. Her work reflects a broader focus on artificial intelligence and Web3 technologies.
Tatev maintains a diversified crypto portfolio, with Bitcoin as her primary holding above CoinChapter’s $1,000 disclosure threshold.