Bitcoin is moving higher above the $90,000 pivot zone. BTC is consolidating gains and might aim for an upside break above $96,200.
Bitcoin Price Approaches Key Hurdle
In the past few days, Bitcoin price saw a decent increase from the $74,500 support zone. BTC climbed above the $80,000 and $85,000 resistance levels to move into a positive zone. More importantly, the price remained stable and supported above the 50-week simple moving average (blue).
The bulls even pumped the price above the $90,000 pivot level. It opened the doors for a move above the 50% Fib retracement level of the downward move from the $109,590 swing high to the $74,501 low.
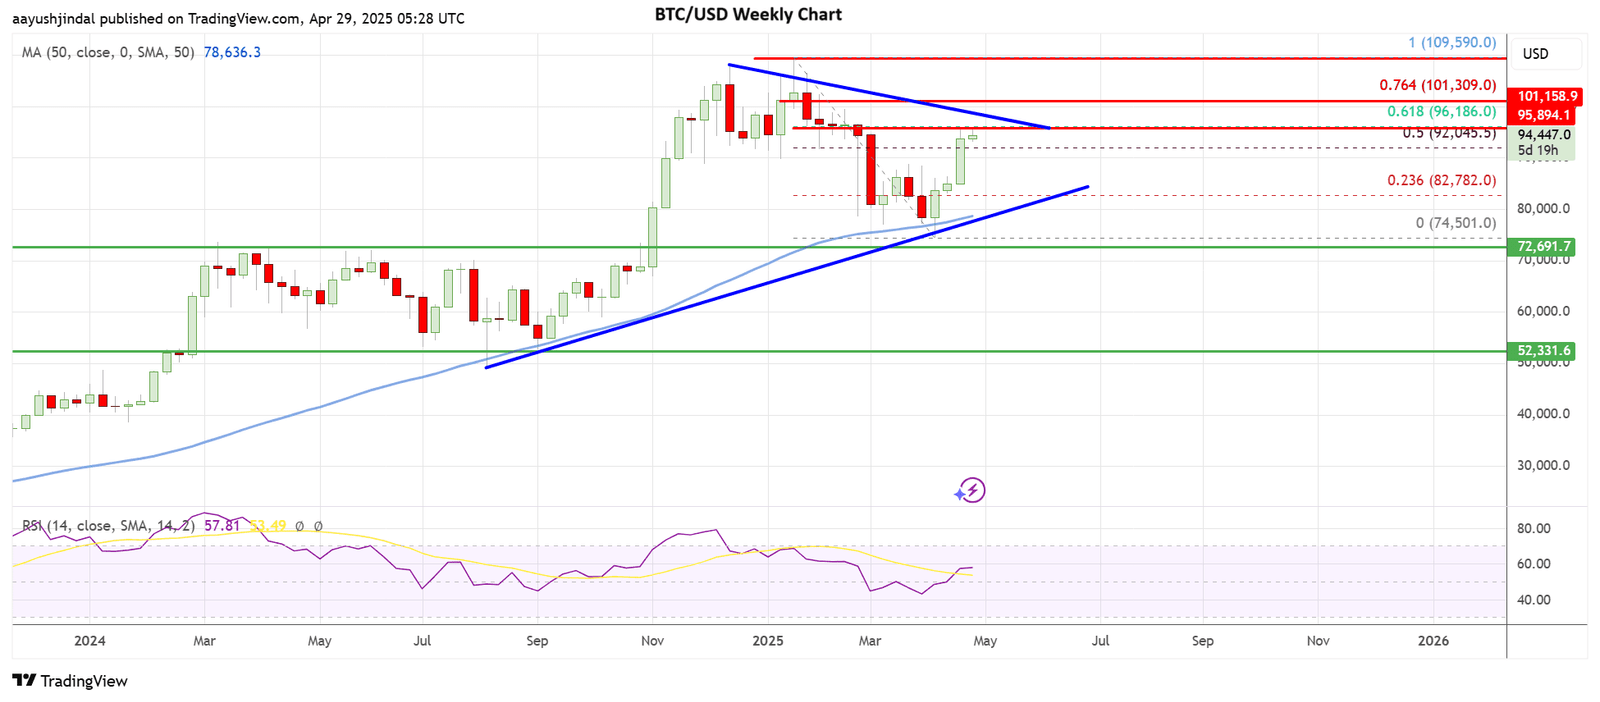
The weekly chart of BTC suggests the price now shows signs of strength above the $92,000 level and is well above the 50-week simple moving average (blue).
However, the bulls now face a crucial challenge near the $95,500 and $96,200 levels. There is also a key contracting triangle forming with resistance at 96,500 on the weekly chart. It coincides with the 61.8% Fib retracement level of the downward move from the $109,590 swing high to the $74,501 low.
A convincing move and close above the triangle resistance zone could set the pace for a larger increase. Immediate resistance on the upside above the triangle sits at $100,000. The first key resistance could be $101,300.
A clear move above the $101,300 level could set the pace for a steady increase. In the stated case, the price could rise and test of the $105,000 resistance level. If the bulls succeed in clearing the $105,000 resistance, it could be a strong bullish signal. The next key resistance could be near the $109,600 level. Any more gains might send Bitcoin toward the $112,000 level and a new all-time high.
Downside Correction In BTC?
If Bitcoin fails to clear the triangle resistance, there could be a short-term pullback. Immediate support is near the $91,500 level. The first major support is near the $90,000. The next major support sits near the $87,200 level.
A weekly close below the $87,200 level could start a larger decline. In the stated case, BTC could drop toward the $85,000 pivot level. The main support sits near the triangle’s lower trend line and the 50-week simple moving average (blue) at $80,000.
A downside break and close below the $80,000 support could spark heavy losses. The next key support could be $75,000. Any more losses might call for a move toward the $68,000 zone in the coming weeks.
Overall, Bitcoin shows positive signs but approaches a key hurdle at $96,500. If the bulls remain in action, BTC could clear the hurdle and start a major surge. If not, the bears could aim for a test of the $85,000 support zone.
