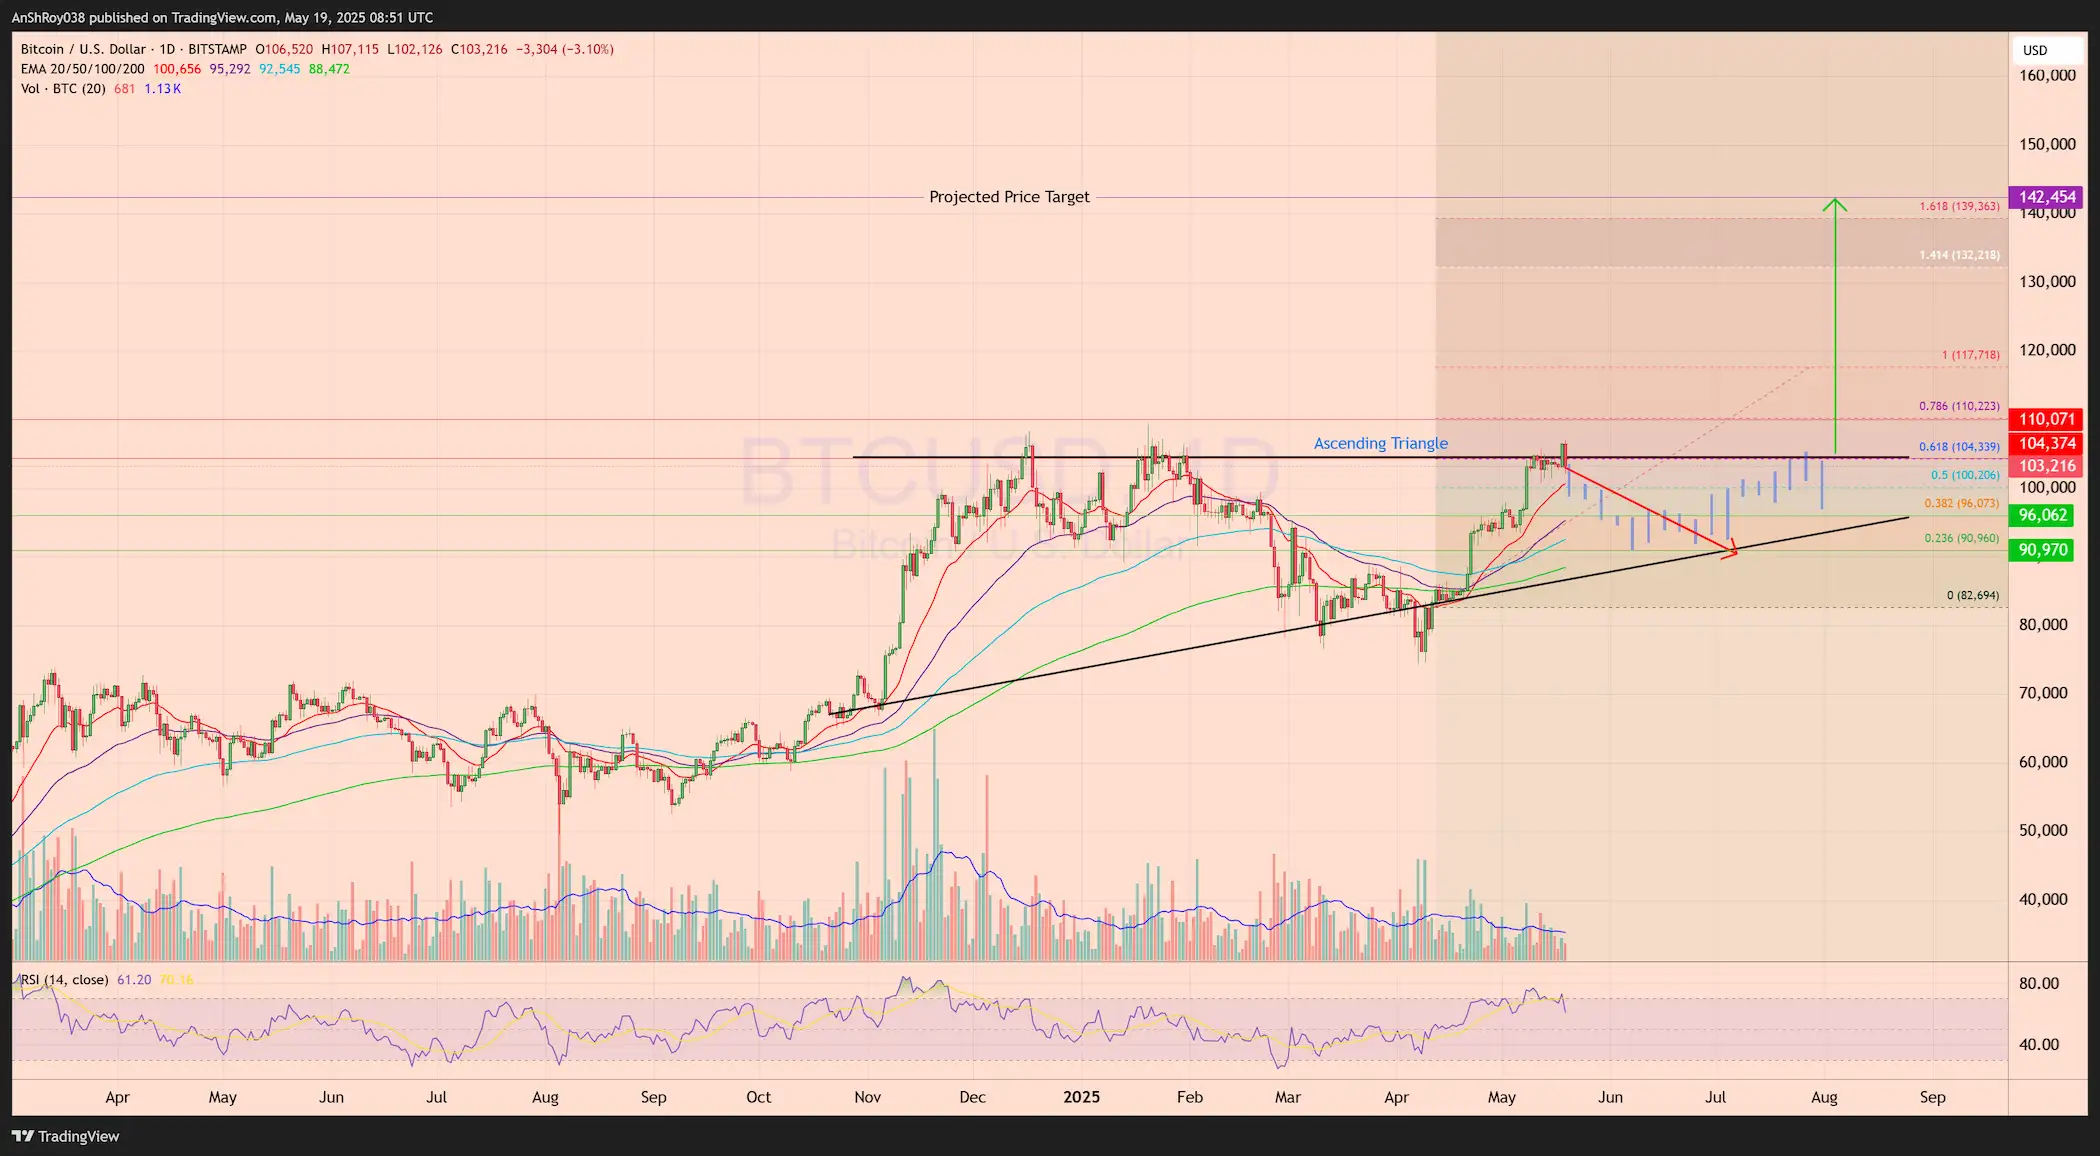
Bitcoin (BTC) hovered near $103,000 on May 19 after recently recording its highest weekly close. The top cryptocurrency briefly touched $107,115 in early Monday trading before trimming gains. This surge propelled Bitcoin’s market capitalization above $2.18 trillion for the first time — a milestone that signals continued institutional demand and macro-driven capital rotation into crypto.
The gains come amid rising global uncertainty. Over the weekend, Moody’s downgraded the U.S. credit outlook, stoking fears of long-term fiscal deterioration. JPMorgan CEO Jamie Dimon added fuel to the fire, warning of a potential recession in the United States. He cited sticky inflation, unresolved trade tensions, and the return of protectionist policies as key threats. These signals have reignited safe-haven bids across risk assets — with Bitcoin, gold, and select equities catching capital inflows.
Meanwhile, a high-stakes trade summit between the U.K. and EU raised concerns about future regulatory shifts that could alter capital flows. The uncertainty is already being felt in currency markets, where traders are pricing in higher volatility premiums for GBP and EUR pairs. In parallel, Japanese firm Metaplanet acquired over 1,000 BTC on Friday, lifting its holdings to 7,800 BTC. The move further cemented Bitcoin’s narrative as a corporate treasury hedge amid global dislocations.
The crypto market now braces for a volatile week with technicals flashing overheated conditions and macro headwinds growing louder.
On-Chain Data Reinforces Bullish Momentum
Bitcoin’s on-chain data continues to reflect robust bullish undercurrents, echoing the macro narrative laid out in the opening section. Realized capitalization crossed a fresh record of $906 billion on May 18, indicating heightened conviction from both institutional and long-term holders.
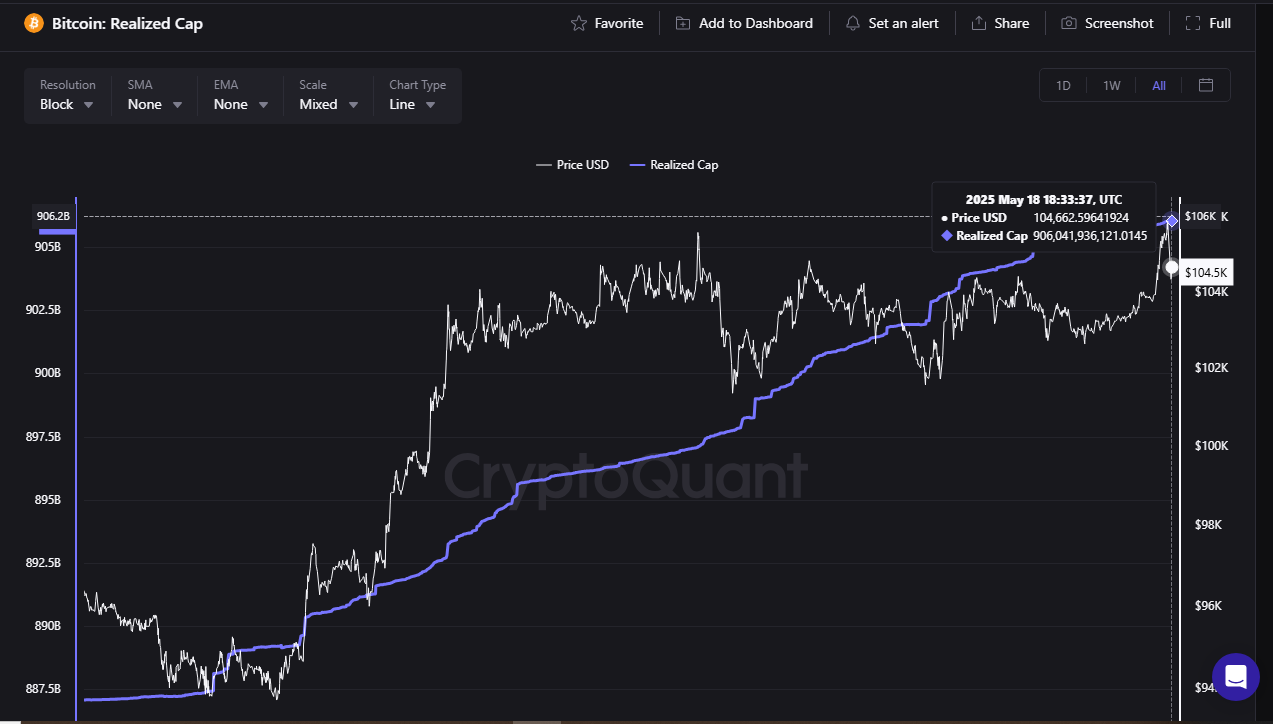
This metric, which assigns value based on the price at which each Bitcoin last moved, adds weight to the ongoing accumulation phase and aligns with Bitcoin’s climb above $104,000.
Notably, the realized cap increased by over $14.3 billion in just ten days, mirroring net inflows into Bitcoin spot ETFs and corporate holdings. BlackRock’s iShares Bitcoin Trust (IBIT) added more than 10,000 BTC during this stretch, reaffirming the strength of demand from institutional allocators.
At the same time, wallet activity in the 100 to 1,000 BTC range grew by 2.2%, with an additional 122,540 BTC accumulated since May 8. This mid-size cohort often represents whales or treasury buyers, reinforcing the strategic nature of accumulation at current price levels.
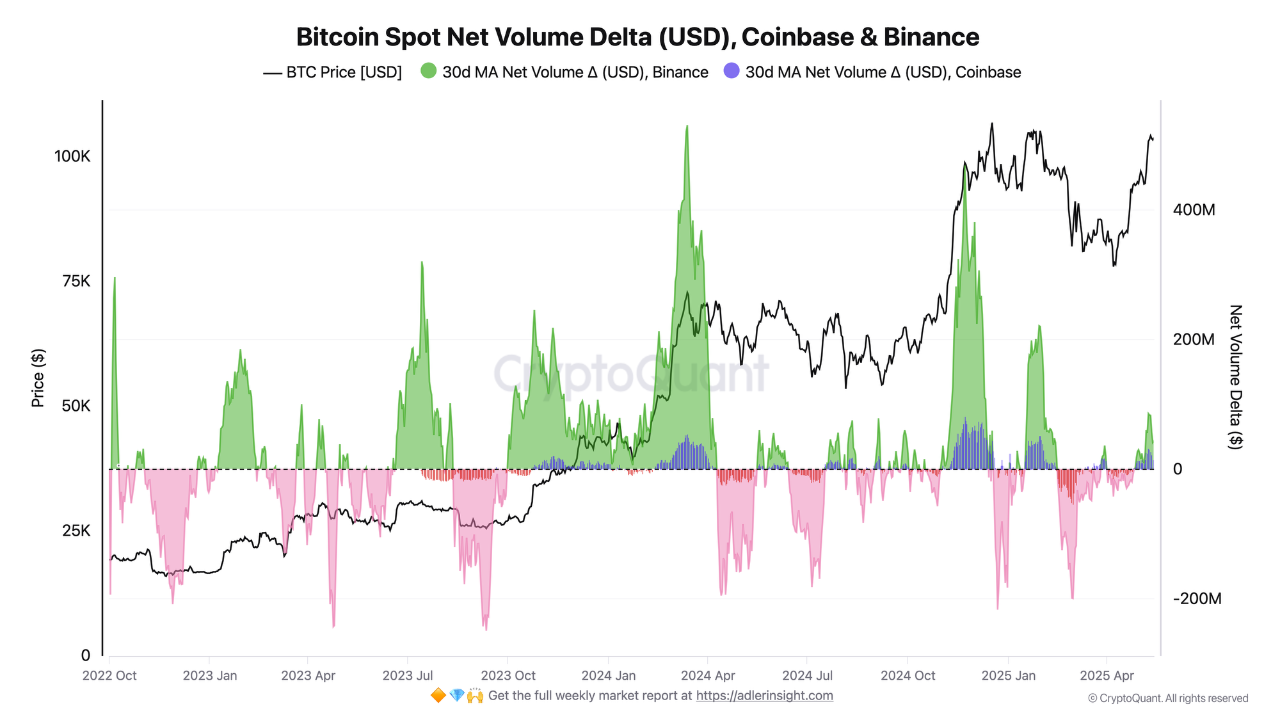
Supporting this, Binance’s spot net volume delta flipped back into positive territory, reflecting a surge in spot market activity and waning sell-side pressure. Historically, sharp increases in this metric have preceded local tops—but in this instance, the move aligns with healthy demand rather than euphoria.
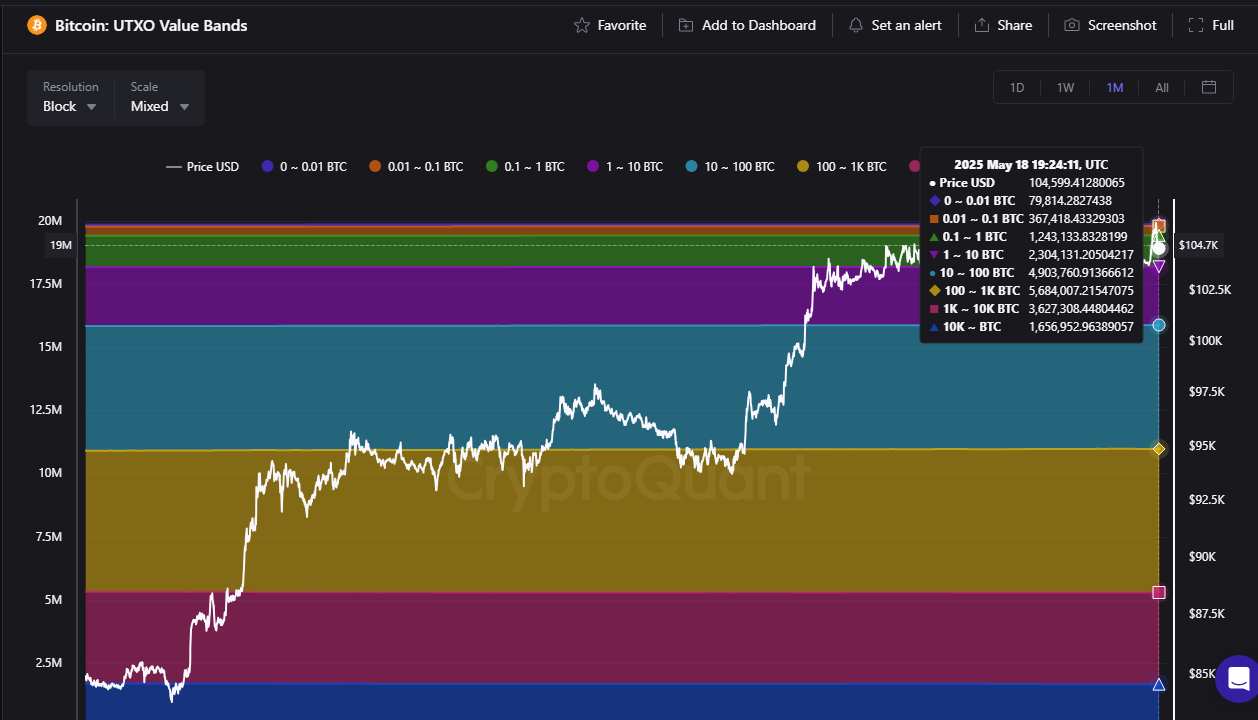
Further, UTXO data shows that Bitcoin supply held by wallets in the 1–10 BTC and 10–100 BTC bands has continued to rise, reinforcing investor confidence across the spectrum. The combination of sustained realized cap growth, fresh ETF demand, and organic wallet accumulation paints a structurally bullish picture as BTC attempts to breach resistance near the $107,000 region.