
Bitcoin may see gains of up to 27% before entering a downtrend, according to Canary Capital CEO Steven McClurg. Speaking on CNBC Friday, McClurg projected the world’s largest cryptocurrency could climb to between $140,000 and $150,000 this year before a new bear market emerges in 2026.
Economic Concerns and Fed Policy
McClurg voiced caution over the broader economy, warning that the Federal Reserve’s delayed response on rate cuts could weigh on markets.
“I don’t like the economic standing at all right now,” he said, adding that the Fed should have cut rates at its last two meetings.
He forecast cuts in September and October. Traders appear to agree, with CME FedWatch Tool data showing a 92.5% probability of a September cut.
McClurg attributed most of Bitcoin’s recent momentum to inflows into spot Bitcoin ETFs and growing purchases from treasury firms.
“That’s what is really driving price,”
he said.
Large allocations from sovereign wealth funds and growing interest from insurance companies have also played a key role, he added. Still, McClurg expects treasury-driven demand to peak in the coming months.
Diverging Views From Industry Leaders
Other executives offered more bullish forecasts. MicroStrategy co-founder Michael Saylor dismissed the prospect of another bear market. Speaking in June, he said, “Winter is not coming back. If Bitcoin’s not going to zero, it’s going to $1 million.”
Bitwise Chief Investment Officer Matt Hougan echoed optimism. In a July video on X, he said he expects Bitcoin’s bull market to extend beyond 2025.

“I bet 2026 is an up year,”
Hougan said.
“I broadly think we’re in for a good few years.”
Ascending channel points to ~18% upside toward $139,658 if breakout confirms
On Aug. 17, 2025, at 09:16 Coordinated Universal Time, the four-hour Bitcoin chart shows an ascending channel. Price sits near $118,354 on the capture, with the 50-period exponential moving average around $118,390 acting as dynamic support. If price breaks and closes above the channel’s upper boundary near $125,000, the structure would confirm scope for an advance of roughly 18% from the current level to about $139,658, close to the marked $140,361 area.

An ascending channel is a trend pattern where price fluctuates between two rising, roughly parallel lines. The lower line connects higher lows and indicates persistent dip buying. The upper line connects higher highs and marks supply. Traders look for confirmation when price closes above the upper line with rising turnover, which signals that demand is strong enough to absorb overhead offers. Failure to hold that breakout often results in a return to the channel or a reversal.
The chart places support along the rising lower boundary that has climbed from early-July levels to the $118,000–$119,000 zone by mid-August. Resistance has repeatedly capped rallies into the $124,000–$126,000 area. Price currently hugs the exponential moving average and rides just above the lower rail, which keeps the structure constructive but demands follow-through. A decisive four-hour close above roughly $125,000, ideally with expanding volume, would validate the channel break and keep $139,658–$140,361 in play.
If the move stalls and price closes back beneath the lower boundary, the pattern would lose credibility and shift focus to downside checkpoints near $116,000 and then the low-$112,000s. Absent a breakdown, the channel also implies a classic measured move of the channel’s height—about $6,000 to $7,000—projecting into the $131,000–$133,000 region. However, the stronger breakout extension from today’s print points toward the 18% objective near $139,658, aligning with the high-$139,000 to $140,000 zone highlighted on the chart.
Bitcoin RCI ribbon shows mixed momentum signals
On Aug. 17, 2025, at 09:26 Coordinated Universal Time, the Bitcoin chart displayed a Rank Correlation Index (RCI) ribbon with multiple timeframes — 10, 30, and 50 periods — showing diverging momentum. The short-term RCI (blue) stood at 73.33, pointing to strong upward pressure and nearing the overbought zone above +80. The mid-range RCI (green) registered –7.25, reflecting neutrality, while the longer-term RCI (red) showed –72.73, indicating persistent downside momentum in the broader trend.
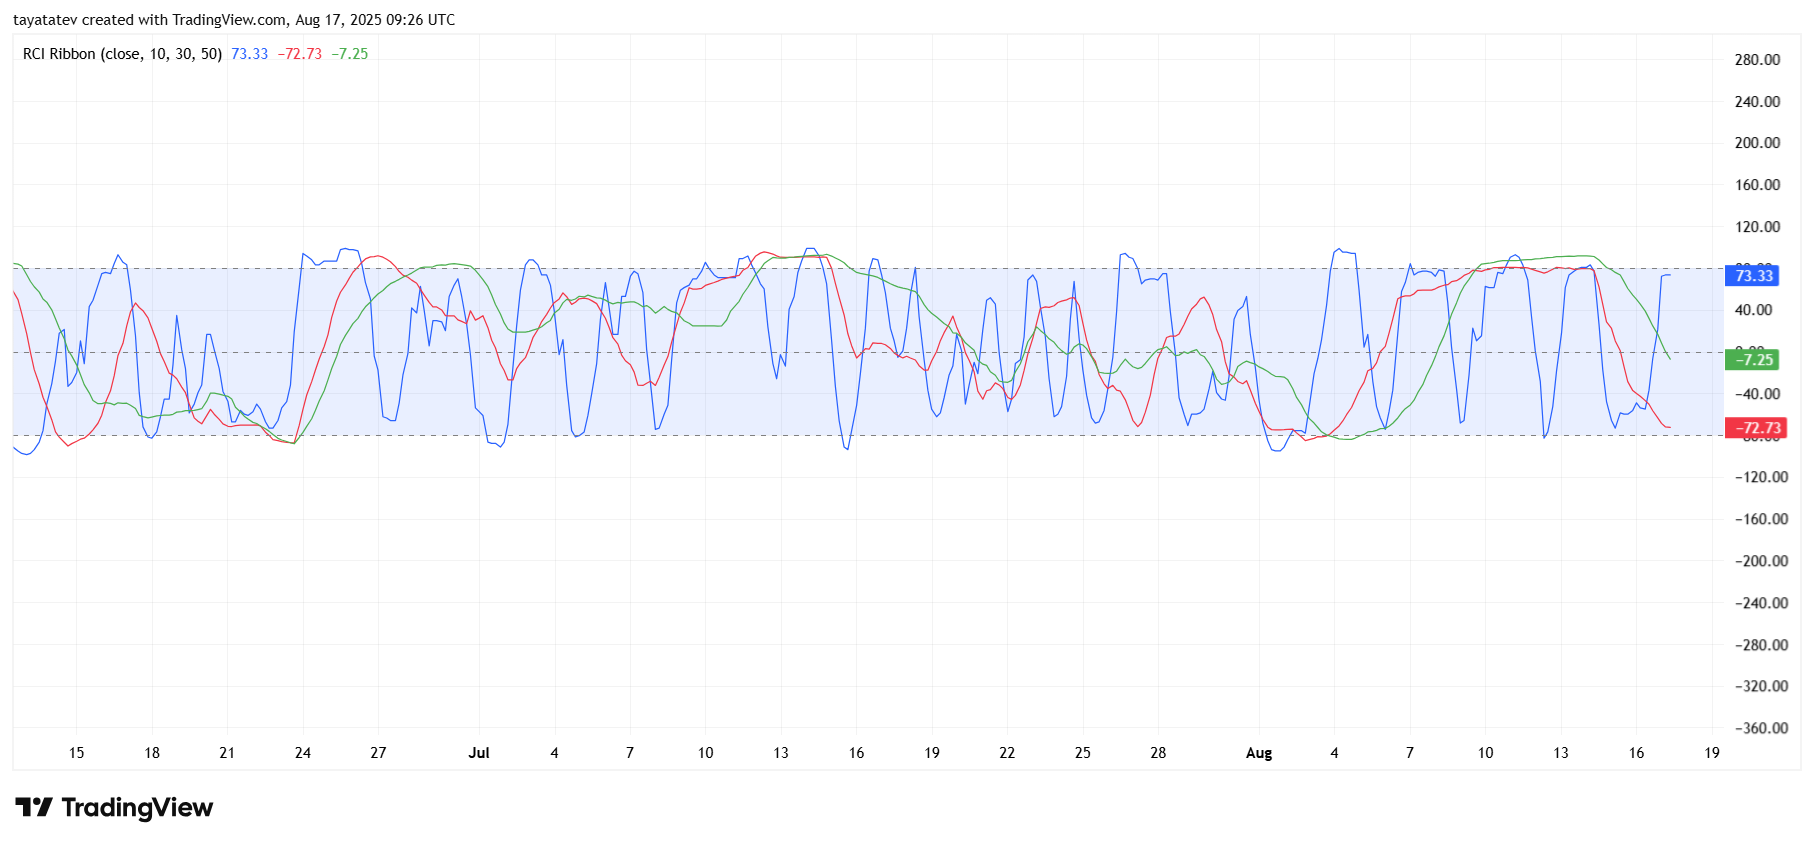
Source: TradingView
The RCI ribbon is an oscillator that measures correlation between price ranks and time. When the indicator rises above +80, it suggests potential overbought conditions, while readings below –80 imply oversold levels. Crossovers between short-term and long-term RCIs often act as trading signals, highlighting possible reversals.
Currently, the positive short-term momentum clashes with the negative longer-term reading, which underscores market indecision. The upward bias on the short horizon shows buyers pressing the market, likely influenced by recent consolidation above $118,000. However, the long-term weakness warns that without sustained demand, rallies may fade before confirming a breakout.
If the short-term RCI holds positive and drags the mid-range into neutral-to-bullish territory, Bitcoin could retest the $124,000–$125,000 zone highlighted in price charts. A failure to maintain this momentum would risk pulling the short-term RCI back toward zero, reinforcing the longer-term bearish bias. This mixed setup signals that the next few sessions are critical for direction, with confirmation needed either from a breakout above $125,000 or a breakdown below the $116,000 area.
Bitcoin RSI signals neutral momentum with slight bullish tilt
On Aug. 17, 2025, at 09:29 Coordinated Universal Time, Bitcoin’s 14-period Relative Strength Index (RSI) chart showed the indicator at 49.65, with its moving average line at 43.32. Both readings sit in the middle of the RSI scale, which ranges from 0 to 100, pointing to balanced momentum rather than a clear trend.
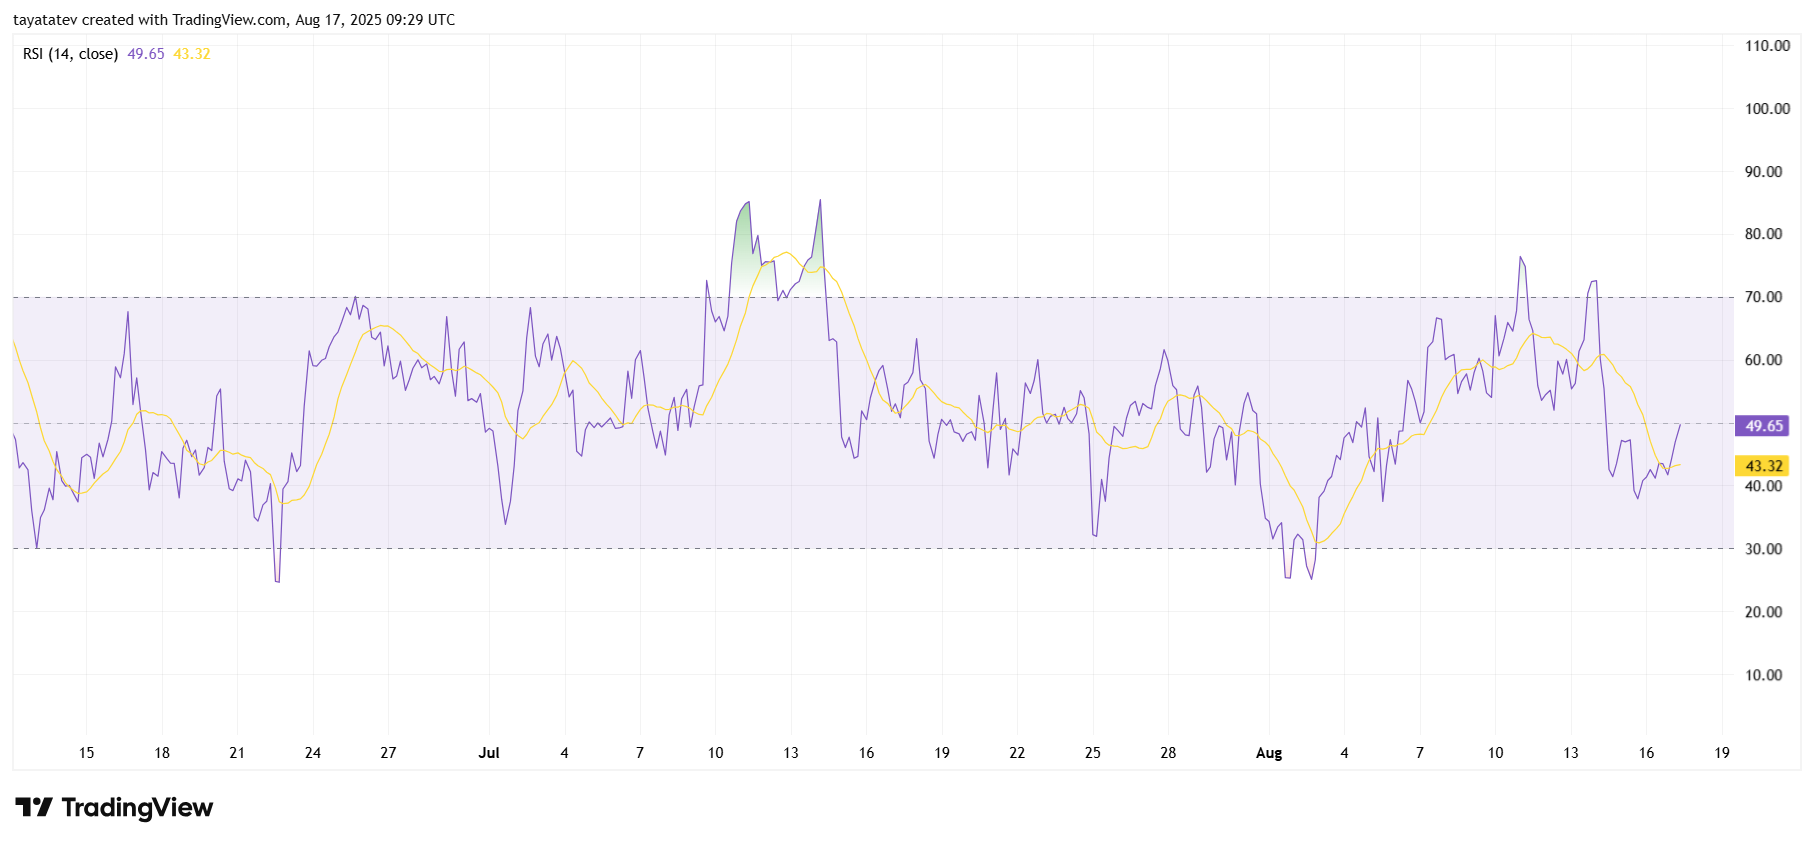
The Relative Strength Index (RSI) tracks the speed and size of price changes. It shows when Bitcoin is overbought or oversold. A value above 70 often signals overheating and a correction. A value below 30 points to oversold conditions and a rebound.
The current reading sits near 50. This level shows no extremes and points to consolidation. The RSI has also turned higher above its average. This move signals that short-term buyers are regaining control.
If the RSI climbs toward 60 and beyond, momentum will strengthen. In that case, Bitcoin may retest resistance near $124,000 to $125,000. However, if the RSI slips under 40, weakness will return. This drop would raise the risk of a pullback below $116,000.
Momentum is neutral for now. Still, the recent bullish crossover hints at recovery. The next move depends on whether buyers can hold pressure in the coming sessions.
